
Brent crude oil price today affects far more than just the cost you see at the petrol station. It shapes airline profitability, manufacturing input costs, headline inflation readings, and Federal Reserve interest rate decisions. Every time OPEC meets, every time a Middle Eastern conflict escalates, and every time China’s industrial output data surprises, the brent crude oil price today shifts in response.
This page explains what drives the brent crude live price per barrel, how to read the crude oil price chart today, and what the current oil market environment means for investors watching energy stocks and macroeconomic conditions in 2026.
Disclaimer: Commodity prices are highly volatile. This page is for educational and informational purposes only. Nothing here is investment advice or a recommendation to buy or sell any security or commodity.
Reference: US Energy Information Administration (EIA) publishes weekly Brent crude data and reports
Before reading any crude oil price chart today, it helps to know exactly what Brent crude is and why it matters more than other oil price references.
Brent crude originates from the North Sea, specifically from the Brent, Forties, Oseberg, Ekofisk, and Troll oil fields operated primarily by UK and Norwegian producers. It has been the international benchmark for crude oil pricing since the 1980s. When a news headline mentions “oil prices,” it almost always refers to the brent crude oil price today, not the US-domestic WTI benchmark.
Roughly two-thirds of the world’s traded oil contracts, including those used by governments to set royalty and budget calculations, are priced relative to Brent. OPEC member states use it as their reference price. Airlines hedging jet fuel costs use it. Refineries across Europe and Asia use it. The brent crude oil price today is, in the most practical sense, the global price of energy.
The brent crude vs wti oil difference confuses many investors because both prices appear in financial news and both track the same commodity in broad terms. But they represent different grades from different supply basins with different logistics.
| Feature | Brent Crude | WTI Crude |
|---|---|---|
| Origin | North Sea (UK and Norway) | Cushing, Oklahoma, USA |
| Exchange | ICE Futures Europe | NYMEX (CME Group) |
| Global Role | International benchmark | US domestic benchmark |
| Typical Price Relationship | Usually $2 to $4 above WTI | Slightly below Brent |
| Sulphur Content | Low – “light sweet” crude | Very low – “light sweet” crude |
| ETF Exposure | BNO (US Brent Oil Fund) | USO (US Oil Fund) – roll costs apply |
The brent crude spread to wti tells you something useful about the relative balance between US domestic supply and global export demand. When US shale production from the Permian Basin surges faster than export infrastructure can handle, domestic supply builds up at Cushing, Oklahoma, and WTI trades at a wider discount to Brent. When US pipelines and ports move oil efficiently to global buyers, the spread narrows.
Most investors outside the United States should anchor their oil market analysis to the brent crude oil price today rather than WTI. Most international headlines do the same.
Four forces drive the brent crude oil price today. Knowing which force is dominant at any given moment is the real skill in oil market analysis.
OPEC+ is a coalition of 23 oil-producing nations including Saudi Arabia, Russia, the UAE, Iraq, Kuwait, and others. Together they control roughly 40% of global crude oil production. When OPEC+ votes to cut output, supply shrinks and the brent crude live price per barrel rises. When it increases production quotas or allows members to exceed caps, prices fall.
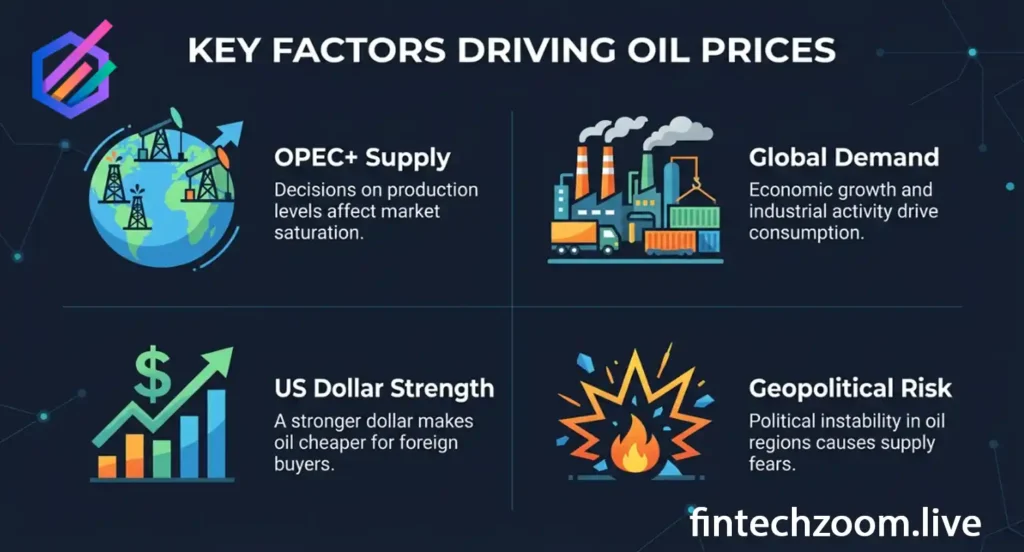
Saudi Arabia functions as the de facto swing producer within OPEC+. The Kingdom’s fiscal breakeven oil price, the brent crude level at which Saudi Arabia’s government budget balances, sits at approximately $80 per barrel in 2026. When the brent crude oil price today falls below that level, Riyadh typically pushes for deeper cuts or extends existing voluntary reductions.
China, the United States, and India are the three largest oil consumers. Together they account for roughly 45% of global oil demand. When these economies grow faster than expected, industrial activity, transport, and manufacturing all consume more energy. That increased consumption tightens global supply and pushes the brent crude oil price today higher.
The crude oil demand forecast 2025 and 2026 has been shaped by two competing forces: a gradual recovery in Chinese industrial activity following post-pandemic adjustments, and a structural shift toward electric vehicles that is beginning to reduce the rate of demand growth in Europe and parts of Asia.
Oil is priced globally in US dollars. When the dollar strengthens against other major currencies, oil becomes more expensive in local currency terms for buyers in Europe, Japan, India, and China. That reduces the purchasing power of international buyers, softening demand and typically pushing the brent crude oil price today lower.
The inverse also holds: a weaker dollar makes oil cheaper for non-US buyers, supporting demand and price. The Federal Reserve’s interest rate decisions, which heavily influence the dollar’s value, therefore have a direct transmission mechanism to the brent crude live price per barrel.
Geopolitical events can remove significant oil supply from the market with little warning. Middle Eastern conflicts affecting the Strait of Hormuz, through which roughly 20% of global oil trade flows, represent the single largest potential supply disruption in the oil market. Libyan production outages, Nigerian pipeline sabotage, and Venezuelan export collapses have all caused meaningful short-term spikes in the brent crude oil price today over the past decade.
OPEC production cut news moves markets faster than almost any other scheduled economic event. When OPEC+ announces an unexpected production cut, the brent crude oil price today can jump $3 to $8 per barrel within hours of the announcement. When members announce they will increase production or have been exceeding quotas, the market can drop by a similar magnitude.
OPEC+ holds formal ministerial meetings roughly every four to six months, but the group can convene emergency meetings at any time. Saudi Arabia and Russia, the two largest producers in the alliance, have historically coordinated closely on messaging before formal announcements to manage market expectations.
In 2026, the OPEC+ alliance has maintained production discipline even as some member nations have exceeded their agreed quotas. Iraq and the UAE have both been flagged in recent monitoring reports for producing above their targets. Despite this, Saudi Arabia has continued to extend voluntary cuts of approximately one million barrels per day beyond the group’s formal reduction, which has supported the brent crude live price per barrel above $78 for most of the year.
Are you monitoring OPEC+ meeting outcomes as part of your energy investment process? These scheduled meetings are the single most predictable source of short-term oil price volatility and are the most important events on any oil market calendar.
Reference: OPEC official production data and meeting communiques at opec.org.
The Russia-Ukraine conflict that began in February 2022 created one of the most significant supply disruptions in modern oil market history. Western sanctions threatened to remove over three million barrels per day of Russian crude from the global market.
In practice, Russia rerouted the majority of its oil exports to China and India at discounted prices, selling below the G7 price cap. The oil price russia ukraine impact has therefore been more about market structure than total volume removed: Russian oil remains in the global supply balance, but it flows through different channels, at different prices, and with different logistics.
The consequences for the brent crude oil price today have been complex. The initial spike in March 2022 took Brent above $130 per barrel. The subsequent price normalization reflected the rerouting rather than a genuine supply removal. But the underlying risks have not disappeared. Continued Western sanctions on Russian shipping insurance, payment processing, and tanker fleets create ongoing uncertainty about Russian export capacity. Any escalation that disrupts Black Sea transit routes or increases insurance costs for Russian cargo ships represents a genuine upside risk to the brent crude oil price today.
Energy sector companies with non-Russian production, including ExxonMobil, Chevron, Shell, and TotalEnergies, benefited from elevated Brent crude pricing during 2022 and 2023. Refineries in Central Europe and some parts of Asia that historically processed Russian crude grades faced input cost pressure as they sought alternative supplies.
The oil price outlook 2025 and into 2026 sits in a tension between disciplined OPEC+ supply management on one side and rising US shale production on the other. Here are the four scenarios most widely modeled by energy analysts.
| Scenario | Brent Price Range | Probability | Key Trigger |
|---|---|---|---|
| Base case: OPEC+ discipline holds | $75 to $90 per barrel | 50% | Saudi and Russian compliance with agreed cuts |
| Bullish: geopolitical supply shock | $95 to $120+ per barrel | 20% | Middle East escalation or major producer outage |
| Bearish: global demand slowdown | $60 to $75 per barrel | 20% | China economic weakness or US recession |
| Bearish: OPEC+ fracture | $55 to $70 per barrel | 10% | Members break quotas, price war begins |
The most underappreciated factor in the brent crude oil forecast 2025 and beyond is the speed at which US shale production responds to price signals. Permian Basin operators have demonstrated they can add meaningful output within six to nine months of the brent crude oil price today rising above $70 per barrel. This rapid supply response acts as a natural ceiling on sustained price gains and is why most Wall Street oil strategists cap their base-case Brent forecasts in the \$80 to \$95 range for 2026.
The global oil supply shortage 2025 scenario, where geopolitical disruptions simultaneously remove more than two million barrels per day from multiple producing regions, remains a tail risk but not a base case. The probability rises meaningfully in scenarios where Iran-Israel tensions escalate to direct confrontations affecting the Strait of Hormuz.
What is your current portfolio exposure to oil prices? Even investors without direct energy holdings are affected through inflation expectations and the Federal Reserve’s response to sustained energy-driven price increases.
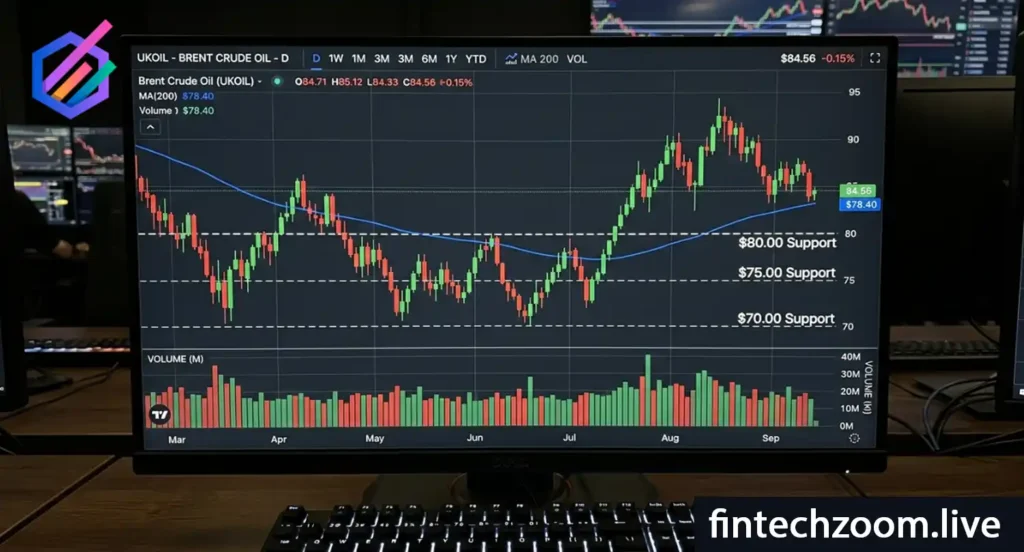
Brent crude technical analysis today uses the same tools as equity technical analysis. Moving averages, support and resistance levels, relative strength index (RSI), and MACD are the most widely used.
The 200-day moving average on the Brent crude daily chart is the single most widely watched technical level among energy traders and systematic funds. When the brent crude oil price today trades above its 200-day moving average, the broad trend is positive and many quantitative strategies maintain long exposure. When it falls below, systematic traders reduce long positions and some initiate short exposure.
Support at round-number levels, particularly $70, $75, $80, and $85 per barrel, tends to be self-reinforcing in oil markets. Airlines, shipping companies, and utilities that run formal hedging programs often have pre-set re-entry levels at round numbers. Sovereign wealth funds from oil-exporting nations similarly have defined price floors at which they increase equity exposure. This creates a clustering of buy orders near these levels that limits downside momentum.
The 50-day moving average on the Brent crude chart functions as a shorter-term trend indicator. When the 50-day crosses above the 200-day (a “golden cross”), it signals a strengthening uptrend. The reverse crossing (a “death cross”) signals deteriorating momentum.
RSI readings above 70 on the brent crude oil price today chart indicate overbought conditions that have historically preceded short-term pullbacks of $4 to $10 per barrel. RSI below 30 has historically marked durable bottoms where OPEC intervention or demand recovery quickly reversed the decline.
The energy sector stocks brent crude relationship is not a simple one-to-one correlation on a daily basis. Oil company stocks also reflect management quality, balance sheet strength, dividend sustainability, and refining margins. But over any quarter or year, sustained changes in the brent crude oil price today drive earnings, free cash flow, and ultimately stock valuations.
Oil major stocks xom cvx today represent the two largest US-listed integrated oil companies. ExxonMobil and Chevron both have upstream fiscal breakeven oil prices below $50 per barrel, meaning they generate positive free cash flow even if the brent crude oil price today falls to levels not seen since the 2020 pandemic lows.
At $80 Brent crude, both companies generate substantial free cash flow. ExxonMobil generated over $36 billion in operating cash flow in its most recent full fiscal year. Chevron returned more than $15 billion to shareholders through dividends and buybacks. Both companies have maintained or increased dividends through multiple oil price cycles, making them among the more resilient options for investors seeking energy sector exposure.
At $60 Brent, margins compress significantly but both companies remain cash-flow positive. At $50, project economics deteriorate and capital expenditure programs are typically cut. At $100 or above, both companies generate windfall cash flows that historically flow back to shareholders through accelerated buybacks.
Brent crude oil etf 2025 and 2026 options for investors seeking direct price exposure include:
BNO (United States Brent Oil Fund): Tracks the near-month Brent crude futures contract. Provides direct price exposure but carries roll yield costs in contango markets that can reduce long-term returns by 5 to 15% annually.
DBO (Invesco DB Oil Fund): Uses an optimized roll strategy designed to reduce roll costs in contango conditions. Tracks a broader basket of Brent-linked futures maturities rather than just the front month.
Both ETFs are appropriate for short-term trading or tactical hedging. Neither is recommended as a long-term buy-and-hold investment given the compounding drag from futures roll costs when the oil market is in contango, which describes a market where future-month contracts trade above spot prices.
Does your energy stock thesis rest on a specific oil price assumption? If the brent crude oil price today fell to $60 per barrel, would your energy holdings still meet your return requirements?
The oil price impact on inflation is direct, measurable, and well-documented in Federal Reserve research. Energy accounts for approximately 7% of the US Consumer Price Index (CPI). A sustained 20% increase in oil prices typically adds approximately 0.6 to 0.8 percentage points to headline CPI over the following six months.
The secondary effects are even broader than the direct energy component suggests. Higher oil prices raise transportation costs for physical goods. Every product that moves by truck, ship, or plane becomes more expensive to deliver. These transportation cost increases ripple through the supply chain and show up in the prices consumers pay for food, electronics, clothing, and retail goods, all of which sit in the non-energy components of CPI.
In 2026, the Federal Reserve watches brent crude oil price today movements with particular attention. The Fed’s preferred inflation measure, the Personal Consumption Expenditures (PCE) index, has lower energy weighting than CPI but still transmits oil price increases. A sustained spike in Brent crude above $100 per barrel would add inflationary pressure that could delay the rate-cutting cycle equity markets have been pricing in.
The oil price impact on inflation also affects the political economy of energy policy. High gasoline prices reduce consumer confidence and disposable income, making energy costs a frequent factor in electoral politics. This political sensitivity is part of why the US has historically maintained the Strategic Petroleum Reserve (SPR) as a policy tool for releasing supply during acute price spikes.
How would your portfolio perform if sustained oil prices drove inflation back above 4%? That scenario would likely mean higher-for-longer interest rates and meaningful pressure on growth and technology stock valuations.
Reference: Federal Reserve research on energy price pass-through to inflation
Brent crude futures today live refers to the ICE Brent futures contract, which trades on the Intercontinental Exchange (ICE) in London and on electronic platforms 24 hours a day, five days a week. Each contract represents 1,000 barrels of crude oil.
The front-month futures contract, the nearest delivery date, is what most financial media report as the brent crude oil price today. But futures markets price oil across a curve of delivery dates extending years into the future. The shape of this curve, whether it slopes upward (contango) or downward (backwardation), tells you about current supply and demand balance.
Contango occurs when future-dated contracts trade above the spot price. It signals that the market believes supply is adequate now but prices will rise in the future, or that storage costs are being priced in. Contango environments penalize rolling oil ETF positions.
Backwardation occurs when near-term contracts trade above longer-dated ones. It signals tight current supply relative to demand and has historically been associated with stronger near-term oil price momentum.
In 2026, the Brent crude futures curve has alternated between mild contango and mild backwardation depending on OPEC+ meeting outcomes and weekly US inventory data releases from the EIA.
Risk Warning: Commodity ETFs that use futures contracts carry roll costs that reduce long-term returns. Direct oil futures trading involves margin requirements and leverage that can produce losses exceeding initial capital. These instruments require specialist knowledge and are not appropriate for most retail investors.
| Period | Average Brent Price | Key Driver |
|---|---|---|
| 2020 (COVID low) | $42 per barrel | Demand collapse, Saudi-Russia price war |
| 2021 | $71 per barrel | Post-COVID demand recovery |
| 2022 | $100 per barrel | Russia-Ukraine war supply shock |
| 2023 | $82 per barrel | OPEC+ cuts, China reopening demand |
| 2024 | $80 per barrel | US shale supply offset OPEC cuts |
| 2025 YTD | $78 per barrel | Geopolitical risk premium, soft demand |
| 2026 Base Case | $75 to $90 range | OPEC+ discipline vs US shale growth |
This table provides historical context for reading the crude oil price chart today. Understanding where the brent crude oil price today sits relative to historical averages helps investors assess whether current prices represent fair value, a supply-driven premium, or a demand-driven discount.
The brent crude oil price today changes continuously during trading hours. Live per-barrel prices are available through the ICE Futures Europe exchange, financial data platforms including Bloomberg and Reuters, and financial news sites like FintechZoom. The EIA also publishes official daily spot price data for Brent at eia.gov.
The brent crude spread to wti exists because Brent serves as the global benchmark and commands a quality and location premium. Brent crude can be delivered directly to European and Asian refinery markets from the North Sea without needing to be piped overland first. WTI, priced at Cushing, Oklahoma, requires additional pipeline or rail transport to reach coastal export terminals, which historically kept WTI at a slight discount to Brent. US infrastructure improvements have narrowed this spread in recent years.
When OPEC+ announces a production cut, it reduces the global supply of crude oil available to refiners. With demand held constant, lower supply puts upward pressure on price. The size and credibility of the cut determines how much the brent crude oil price today moves. A well-coordinated cut from Saudi Arabia with Russian compliance typically produces a $3 to $8 per barrel positive price reaction within 24 hours.
US recessions reduce industrial output, transportation demand, and consumer spending. All of these reduce oil consumption. Historical recession episodes show the brent crude oil price today typically falls 30 to 50% from peak to trough during a significant US or global recession. The 2008 financial crisis saw Brent drop from $147 to $36 per barrel within six months.
The brent crude oil forecast 2025 and 2026 is balanced, with a base case of $75 to $90 per barrel. The upside scenario requires a geopolitical supply shock. The downside scenario requires Chinese economic weakness or an OPEC+ breakdown. Most major energy banks, including Goldman Sachs and JPMorgan, have their 2026 Brent crude forecasts in the $75 to $85 per barrel range as of early 2026.
Petrol prices at the pump reflect the cost of crude oil as an input (roughly 50 to 60% of pump price), refinery processing margins (10 to 15%), distribution and retail costs, and taxes. When the brent crude oil price today rises by $10 per barrel, pump prices typically follow within 2 to 4 weeks, though refinery margins, seasonal demand, and local taxes cause variation by country and region.
The two main US-listed ETFs tracking Brent crude are BNO (United States Brent Oil Fund) and DBO (Invesco DB Oil Fund). Both use futures contracts. European investors can access Brent exposure through physically backed or futures-based ETC products listed on the London Stock Exchange and Euronext. Roll costs in contango markets reduce long-term returns for all futures-based products.
This article is for informational purposes only and does not constitute investment advice. Commodity markets are volatile. Past price levels do not guarantee future performance.

Curated Editorial Insights Across FintechZoom’s Core Verticals: Thought-provoking analysis in Markets, Business Strategy, Crypto Innovation, Personal Finance, Economic Policy, and Lifestyle Wealth, designed to challenge conventional thinking, deepen financial literacy, and empower readers to make smarter, forward-looking decisions.
FintechZoom.Live is your real-time gateway to smarter investing, delivering instant stock market updates, expert analysis, and actionable insights on the stocks that matter most. From Magnificent 7 giants like NVIDIA, Microsoft, and Tesla to high-momentum meme stocks like GameStop and AMC, we cover the full spectrum of opportunities with zero-delay reporting. Our platform specializes in low-competition, high-value SEO content clusters, prioritizing “buy or sell” decision guides, price predictions, and forecast analysis for retail and institutional investors alike. Whether you’re tracking EV disruptors Lucid and Rivian, AI leaders Palantir and C3.ai, or legacy dividend plays like Ford and IBM, FintechZoom.Live provides semantic-rich, data-driven coverage optimized for search visibility and investor clarity. With 50+ stock clusters, 500+ semantic keywords, and real-time market intelligence, we empower you to make informed decisions before the market moves. Your edge starts here live.
Disclaimer
The information provided on FintechZoom.Live is for informational purposes only and should not be considered financial or investment advice. Investing in cryptocurrencies, digital assets, or any financial product involves significant risk, including the potential loss of your entire investment. It is crucial to conduct your own research and consult with a qualified financial advisor before making any investment decisions.
FintechZoom.Live does not endorse any specific investment or financial product. We are not responsible for any losses or damages incurred as a result of using the information on our website.
Please be aware that the regulatory landscape for cryptocurrencies and digital assets is complex and varies across jurisdictions. It is important to understand the applicable regulations in your location before investing.
For further information on U.S. regulations, you may refer to the following resources:
Securities and Exchange Commission (SEC): https://www.sec.gov/
Commodity Futures Trading Commission (CFTC): https://www.cftc.gov/
Financial Crimes Enforcement Network (FinCEN): https://www.fincen.gov/
By using FintechZoom.Live, you acknowledge and agree to this disclaimer.

Your trusted source for stocks, crypto, commodities, and fintech news. Track live prices, explore market trends, and make informed financial decisions with data that moves as fast as the markets.