
Dow Jones Index Today is sitting at a critical inflection point in April 2026, having reached an all-time closing high of 50,512.79 on February 10, then pulling back sharply to the 46,700–47,000 range amid tariff headwinds and rising Treasury yield pressure. This article gives you the full picture: live price context, the 30-stock breakdown, month-by-month 2026 projections from leading forecasters, and the macro forces driving every session.
Technical indicators identify 45,000 as the primary psychological support level. This zone represents both a round-number threshold and a structural floor based on previous resistance-turned-support from late 2025. Secondary support emerges near 43,500–44,000, corresponding with the 200-day moving average zone. Resistance appears first at 48,500, marking the breakdown level from February’s pullback, followed by the major resistance zone at 50,000–50,512, which encompasses the all-time high.
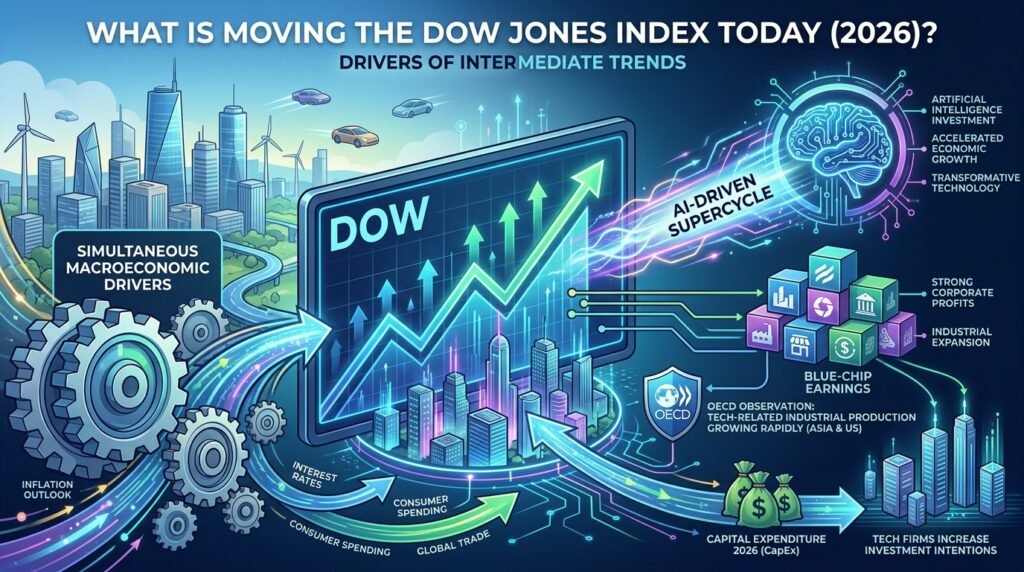
The International Monetary Fund projects US economic expansion of 2.4 percent in 2026, supported by fiscal policy accommodation and lower policy rates.
This growth backdrop provides fundamental support for corporate earnings within the Dow components, though the pace represents a moderation from the 4.3% annualized growth observed in Q3 2025.
Dow Jones futures contracts trade nearly 24 hours daily, providing price discovery before the New York Stock Exchange opens. The E-mini Dow Jones (YM) futures contract trades on the Chicago Board of Trade division of CME Group, with each point of movement worth $5 to traders.
Contract specifications allow traders to gain exposure to the 30 blue-chip companies with controlled leverage.
The Dow Jones Industrial Average uses a price-weighted calculation method rather than market-cap weighting. The sum of all 30 stock prices is divided by a proprietary divisor, which adjusts for stock splits, component changes, and corporate actions.
This methodology means a $1 change in any stock, regardless of company size, moves the index by the same number of points.
| Company | Ticker | Sector | Approximate Share Price | Weighting Impact |
|---|---|---|---|---|
| UnitedHealth | UNH | Healthcare | $520 | High |
| Goldman Sachs | GS | Financials | $510 | High |
| Travelers | TRV | Financials | $250 | Moderate |
| Home Depot | HD | Consumer Discretionary | $360 | Moderate |
| Caterpillar | CAT | Industrials | $310 | Moderate |
| Coca-Cola | KO | Consumer Staples | $68 | Low |
| Verizon | VZ | Telecom | $42 | Low |
The S&P 500 methodology calculates index levels by summing float-adjusted market values and dividing by a divisor, adjusting for shares outstanding and investable weight factors.
This creates different performance dynamics during sector rotations. When growth stocks outperform, the Nasdaq typically leads. When value and defensive sectors strengthen, Dow Jones Index Today often outperforms its broader counterparts.
| Index | Components | Weighting Method | Primary Characteristics |
|---|---|---|---|
| Dow Jones | 30 | Price-weighted | Blue-chip, value tilt, industrial focus |
| S&P 500 | 500 | Float-adjusted market cap | Broad market representation |
| Nasdaq | 3,000+ | Market cap | Tech-heavy, growth-oriented |
The Dow Jones Industrial Average crossed 10,000 for the first time in March 1999 during the dot-com expansion. The index reached 20,000 in January 2017, 35,000 in July 2021 following pandemic recovery efforts, and achieved its current all-time high of 50,512.79 on February 10, 2026.
The first quarter of 2026 began with the index near 48,063 and rallied to the all-time high of 50,512 by February 10. March brought increased volatility as tariff announcements and geopolitical tensions in the Middle East triggered risk-off positioning. The OECD notes that the energy supply shock from Middle East conflicts is testing global economic resilience and creating new inflationary pressures.
Forecasting services project varying trajectories for Dow Jones Index Today through year-end 2026. LiteFinance anticipates the index oscillating between $49,000 and $54,000 throughout the year, with potential to surpass $50,000 by mid-year.
LongForecast.com projects the Dow beginning March 2026 around 52,762 with potential to reach maximum values near 57,380.
| Month | Low (Bearish) | Base Case | High (Bullish) |
|---|---|---|---|
| April 2026 | 43,700 | 44,817 | 45,934 |
| May 2026 | 41,620 | 43,650 | 45,680 |
| June 2026 | 41,366 | 43,472 | 45,578 |
| September 2026 | 49,842 | 50,806 | 51,770 |
| December 2026 | 50,654 | 52,126 | 53,598 |
WalletInvestor forecasts the DJIA reaching $53,800 by year-end, assuming continued economic growth and stable corporate earnings. Trading Economics presents a more bearish case at 42,639 for a 12-month horizon.
Fintech Research Resources 2026 maps the entire global fintech intelligence landscape, from KPMG’s funding recovery data and WEF’s profitability benchmarks to BIS CBDC trackers and AI in finance projections, giving investors, founders, and analysts a verified, source-ranked directory of the reports that actually move decisions in a $460 billion market.
Federal Reserve decisions remain the single largest macro driver of Dow Jones Index Today. The FOMC maintained the target range for the federal funds rate at 3-1/2 to 3-3/4 percent at its March 2026 meeting, with inflation remaining somewhat elevated according to official statements.
Governor Michelle Bowman indicated her Summary of Economic Projects includes three cuts for 2026, with policy currently moderately restrictive.
Lower rates reduce discount rates on future earnings, generally lifting equity valuations. The FOMC’s Summary of Economic Projections indicates GDP growth moderating through 2027, with participants assessing appropriate monetary policy paths to foster maximum employment and price stability.
Trade policy uncertainty continues weighing on Dow Jones Index Today, particularly for industrial components with significant international exposure. The OECD notes that changes in US bilateral tariff rates since mid-November have lowered the effective tariff rate on US merchandise imports to an estimated 9.9%, though uncertainty persists regarding future policy directions.
Secondary support emerges in the 43,500–44,000 zone, coinciding with the 200-day moving average. A breach below this level would signal potential trend reversal rather than mere consolidation. The weekly chart shows a Rising Wedge pattern with bearish target potential near 41,768 if support fails.
Major resistance sits at 50,000–50,512, encompassing the all-time high zone. Breakout above this range targets 53,000–55,000 based on measured move calculations. The MACD and RSI indicators currently show bearish momentum, with RSI near 37 suggesting potential oversold conditions that could support a bounce.
Also Read This
CFOs, 2026 is the year AI stops being a pilot project and becomes core finance infrastructure, from agentic trading systems and explainable credit models to quantum-enhanced fraud detection and continuous real-time accounting.
This practical guide delivers seven high-impact trends, FINRA-ready governance frameworks, and a 30/90/365-day roadmap to scale responsibly while slashing latency, risk, and close cycles.
Dow Jones Index Today maintains positive correlation with major European indices, though the FTSE 100 and DAX 40 have lagged in 2026 amid euro area growth concerns. The OECD projects euro area GDP growth at just 0.8% in 2026, significantly below the US projection.
E-mini Dow Jones (YM) futures contracts provide synthetic exposure to Dow Jones Index Today outside regular trading hours. The contract value equals $5 multiplied by the index value, meaning a Dow level of 46,800 creates a notional contract value of $234,000.

Curated Editorial Insights Across FintechZoom’s Core Verticals: Thought-provoking analysis in Markets, Business Strategy, Crypto Innovation, Personal Finance, Economic Policy, and Lifestyle Wealth, designed to challenge conventional thinking, deepen financial literacy, and empower readers to make smarter, forward-looking decisions.
FintechZoom.Live is your real-time gateway to smarter investing, delivering instant stock market updates, expert analysis, and actionable insights on the stocks that matter most. From Magnificent 7 giants like NVIDIA, Microsoft, and Tesla to high-momentum meme stocks like GameStop and AMC, we cover the full spectrum of opportunities with zero-delay reporting. Our platform specializes in low-competition, high-value SEO content clusters, prioritizing “buy or sell” decision guides, price predictions, and forecast analysis for retail and institutional investors alike. Whether you’re tracking EV disruptors Lucid and Rivian, AI leaders Palantir and C3.ai, or legacy dividend plays like Ford and IBM, FintechZoom.Live provides semantic-rich, data-driven coverage optimized for search visibility and investor clarity. With 50+ stock clusters, 500+ semantic keywords, and real-time market intelligence, we empower you to make informed decisions before the market moves. Your edge starts here live.
Disclaimer
The information provided on FintechZoom.Live is for informational purposes only and should not be considered financial or investment advice. Investing in cryptocurrencies, digital assets, or any financial product involves significant risk, including the potential loss of your entire investment. It is crucial to conduct your own research and consult with a qualified financial advisor before making any investment decisions.
FintechZoom.Live does not endorse any specific investment or financial product. We are not responsible for any losses or damages incurred as a result of using the information on our website.
Please be aware that the regulatory landscape for cryptocurrencies and digital assets is complex and varies across jurisdictions. It is important to understand the applicable regulations in your location before investing.
For further information on U.S. regulations, you may refer to the following resources:
Securities and Exchange Commission (SEC): https://www.sec.gov/
Commodity Futures Trading Commission (CFTC): https://www.cftc.gov/
Financial Crimes Enforcement Network (FinCEN): https://www.fincen.gov/
By using FintechZoom.Live, you acknowledge and agree to this disclaimer.

Your trusted source for stocks, crypto, commodities, and fintech news. Track live prices, explore market trends, and make informed financial decisions with data that moves as fast as the markets.