
Best ETFs to buy in 2026 represent the most efficient vehicle for retail and institutional investors seeking diversified exposure across growth sectors, dividend income, and bond stability. Exchange-traded funds have fundamentally transformed portfolio construction, offering instant diversification with intraday liquidity at costs that continue compressing toward zero. Whether you are tracking Magnificent 7 giants like NVIDIA and Microsoft or hunting high-momentum opportunities in AI, crypto, and EV disruptors, this definitive guide breaks down the best ETFs to buy in 2026 with price forecasts, buy-or-sell signals, and data-driven portfolio recommendations.
| Feature | ETFs | Mutual Funds |
|---|---|---|
| Expense Ratio | As low as 0.03% (VOO, VTI) | Average 0.44% |
| Trading | Intraday on exchanges | End-of-day pricing only |
| Tax Efficiency | In-kind redemption minimizes gains | Frequent capital gains distributions |
| Minimum Investment | One share (~$25-$700) | Often $1,000-$3,000 |
| Transparency | Daily holdings disclosure | Quarterly disclosure |
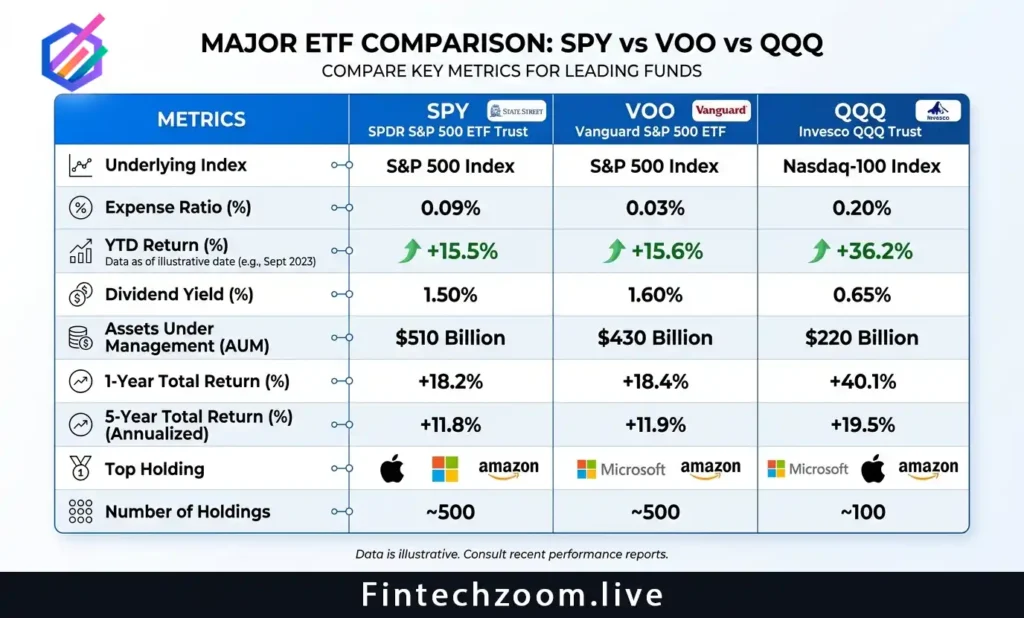
| Metric | SPY | VOO | QQQ |
|---|---|---|---|
| Expense Ratio | 0.0945% | 0.03% | 0.18% |
| AUM | $623.6B | $1.42T | $372.5B |
| YTD Return (2026) | -4.34% | -4.34% | -5.86% |
| 52-Week Change | +26.03% | +26.06% | +33.57% |
| Dividend Yield | 1.14% | 1.19% | 0.49% |
| Beta (3-Year) | 1.00 | 1.00 | 1.11 |
| Top Holdings | Magnificent 7 (~32%) | Magnificent 7 (~32%) | Tech-heavy (~50%) |
Also Read This: Fintechzoom’s deep dive on Uber stock forecasts a $65–$90 price range for 2026, driven by profitability gains across Mobility, Delivery, and Freight, plus Waymo AV partnerships and international expansion.
It positions the stock as a moderate buy on dips for growth investors, while flagging regulatory cost risks and volatility as key watchpoints.
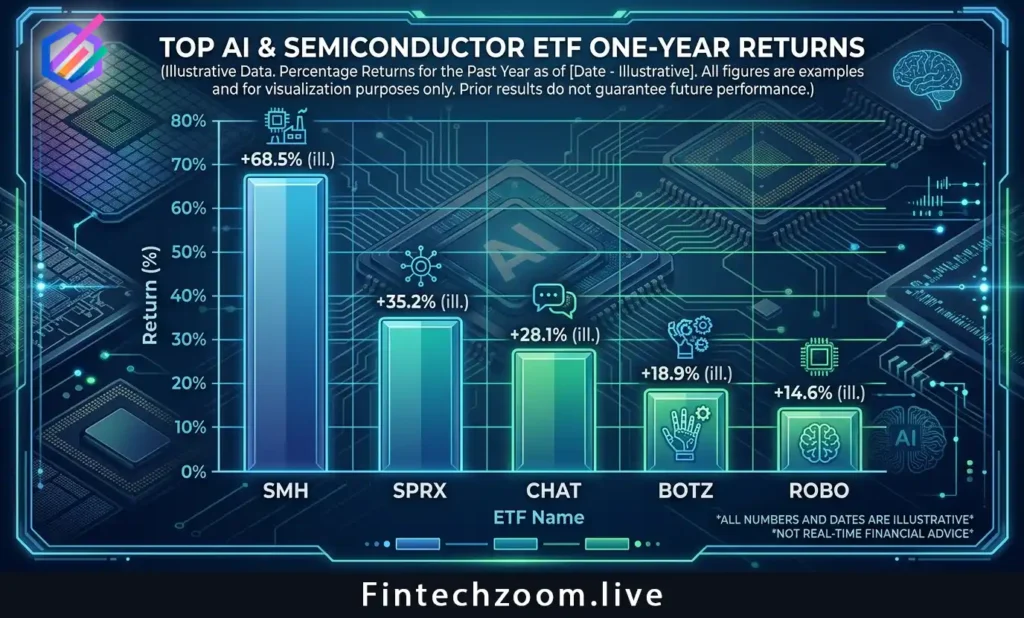
| ETF | Ticker | One-Year Return | Expense Ratio | Focus Area |
|---|---|---|---|---|
| Spear Alpha ETF | SPRX | +126.64% | 0.75% | AI Infrastructure |
| VanEck Semiconductor | SMH | +119.7% | 0.35% | Semiconductors |
| Roundhill Generative AI | CHAT | +111.7% | 0.75% | Generative AI |
| iShares Semiconductor | SOXX | +119.7% | 0.34% | Chip Makers |
| WisdomTree AI Fund | WTAI | +87.39% | 0.45% | AI Innovation |
| ETF | Ticker | Dividend Yield | Expense Ratio | YTD Return |
|---|---|---|---|---|
| Schwab US Dividend Equity | SCHD | 3.44% | 0.06% | +12.71% |
| Vanguard High Dividend Yield | VYM | ~3.0% | 0.06% | +16.2% |
| Vanguard Dividend Appreciation | VIG | ~1.9% | 0.05% | +15.2% |
Also Read This: Fintechzoom’s 2026 Tesla Stock Guide breaks down TSLA’s volatile 2025 ride, delivery records, FSD/robotaxi momentum, and energy-storage wins, while sizing up fierce EV competition, margin pressures, and macro risks.
With analyst consensus, valuation snapshots, and pro-grade charting tools, it’s a sharp, data-driven playbook for growth investors betting on Tesla’s shift beyond cars into autonomy and robotics.
| ETF | Ticker | Expense Ratio | Category | 52-Week Performance |
|---|---|---|---|---|
| Vanguard S&P 500 ETF | VOO | 0.03% | Large Blend | +26.06% |
| Vanguard Total Stock Market | VTI | 0.03% | Total Market | +26.84% |
| Vanguard Growth ETF | VUG | 0.04% | Large Growth | +24.1% |
| Vanguard Russell 1000 Growth | VONG | 0.07% | Large Growth | +22.3% |
| Vanguard Dividend Appreciation | VIG | 0.05% | Dividend Growth | +15.2% |
| Vanguard Total Bond Market | BND | 0.03% | Core Bond | +1.67% |
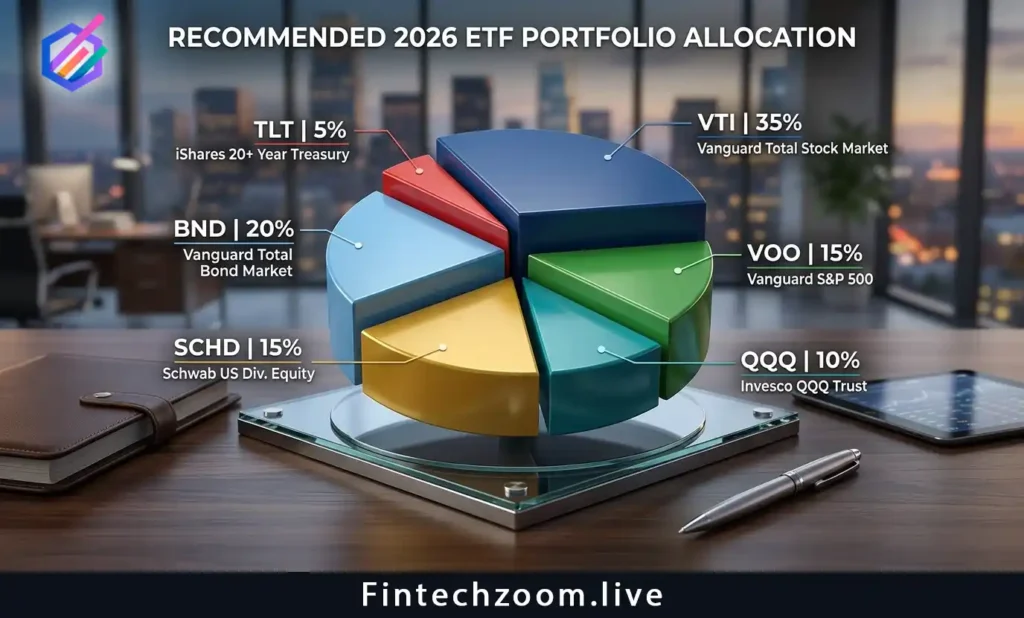
| Allocation | ETF | Ticker | Position Size | Rationale |
|---|---|---|---|---|
| Core Equity | Vanguard Total Stock Market | VTI | 35% | Broadest diversification at 0.03% cost |
| Large-Cap Core | Vanguard S&P 500 ETF | VOO | 15% | Magnificent 7 exposure at lowest fee |
| Growth Satellite | Invesco QQQ Trust | QQQ | 10% | Tech concentration with PEG advantage |
| Dividend Income | Schwab US Dividend Equity | SCHD | 15% | 3.44% yield, 0.66 beta for stability |
| Core Bonds | Vanguard Total Bond Market | BND | 20% | 3.91% yield, duration hedge |
| Rate-Cut Play | iShares 20+ Year Treasury | TLT | 5% | Duration exposure for Fed cuts |

Curated Editorial Insights Across FintechZoom’s Core Verticals: Thought-provoking analysis in Markets, Business Strategy, Crypto Innovation, Personal Finance, Economic Policy, and Lifestyle Wealth, designed to challenge conventional thinking, deepen financial literacy, and empower readers to make smarter, forward-looking decisions.
FintechZoom.Live is your real-time gateway to smarter investing, delivering instant stock market updates, expert analysis, and actionable insights on the stocks that matter most. From Magnificent 7 giants like NVIDIA, Microsoft, and Tesla to high-momentum meme stocks like GameStop and AMC, we cover the full spectrum of opportunities with zero-delay reporting. Our platform specializes in low-competition, high-value SEO content clusters, prioritizing “buy or sell” decision guides, price predictions, and forecast analysis for retail and institutional investors alike. Whether you’re tracking EV disruptors Lucid and Rivian, AI leaders Palantir and C3.ai, or legacy dividend plays like Ford and IBM, FintechZoom.Live provides semantic-rich, data-driven coverage optimized for search visibility and investor clarity. With 50+ stock clusters, 500+ semantic keywords, and real-time market intelligence, we empower you to make informed decisions before the market moves. Your edge starts here live.
Disclaimer
The information provided on FintechZoom.Live is for informational purposes only and should not be considered financial or investment advice. Investing in cryptocurrencies, digital assets, or any financial product involves significant risk, including the potential loss of your entire investment. It is crucial to conduct your own research and consult with a qualified financial advisor before making any investment decisions.
FintechZoom.Live does not endorse any specific investment or financial product. We are not responsible for any losses or damages incurred as a result of using the information on our website.
Please be aware that the regulatory landscape for cryptocurrencies and digital assets is complex and varies across jurisdictions. It is important to understand the applicable regulations in your location before investing.
For further information on U.S. regulations, you may refer to the following resources:
Securities and Exchange Commission (SEC): https://www.sec.gov/
Commodity Futures Trading Commission (CFTC): https://www.cftc.gov/
Financial Crimes Enforcement Network (FinCEN): https://www.fincen.gov/
By using FintechZoom.Live, you acknowledge and agree to this disclaimer.

Your trusted source for stocks, crypto, commodities, and fintech news. Track live prices, explore market trends, and make informed financial decisions with data that moves as fast as the markets.