
Natural gas price today affects household heating bills, electricity generation costs, and the industrial energy expenses of manufacturers across the globe. Whether you are tracking it for a utility budget, an energy portfolio, or plain market curiosity, knowing what drives the number on the screen matters as much as the number itself.
In 2026, US natural gas markets are going through a structural transformation that has no direct historical parallel. The rapid expansion of LNG export terminals has connected domestic gas prices to global demand for the first time. Understanding this shift is the key to reading the natural gas price chart accurately and making better-informed decisions about energy investments.
Disclaimer: Natural gas is a highly volatile commodity. Prices can move 20% or more in a single week during extreme weather events. This article is for educational purposes only and does not constitute investment advice.
External reference: EIA Natural Gas Weekly Update — storage, production, and price data updated every Thursday.
The natural gas price today is quoted in US dollars per million British thermal units, abbreviated as MMBtu. On any given trading day, the front-month NYMEX futures contract for Henry Hub delivery sets the headline number you see on financial platforms and energy news sites.
What makes natural gas price today so different from other commodities is the speed and scale of its moves. Crude oil, gold, and copper typically shift by single-digit percentages in normal trading sessions. Natural gas can surge 10% or fall 15% in a single day when weather forecasts change significantly or when a major pipeline goes offline unexpectedly.
Three forces drive natural gas price volatility more than anything else:
Weather demand shocks. Heating and cooling drive the largest swings in natural gas consumption. A polar vortex descending over the US Midwest in January can add tens of billions of cubic feet per day to demand almost overnight. A heat wave gripping Texas in August pushes power generators to burn gas around the clock. Neither event can be predicted more than about ten days in advance, which means the natural gas price today can reprice sharply on a single updated weather model run.
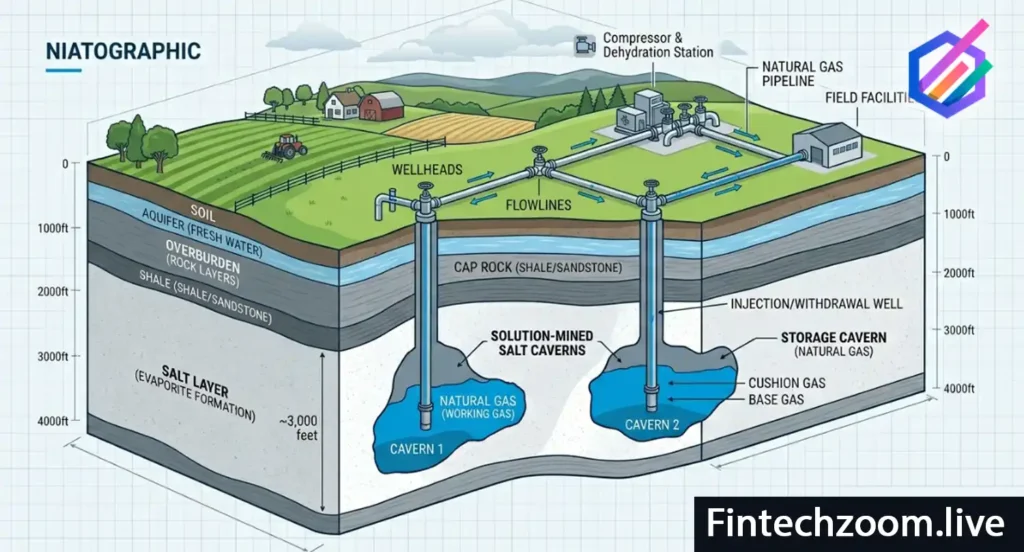
Storage dynamics. The US natural gas market runs on a seasonal storage cycle. Gas is injected into underground storage facilities from April through October, then withdrawn from November through March. When storage levels are below the five-year average heading into winter, prices rise in anticipation of tighter supply. When storage is well above average, prices fall because the market is comfortable with supply.
LNG export demand. This is the newer and increasingly powerful force. US natural gas exports in liquefied form connect Henry Hub prices to global events in ways that were not possible before 2016. A cold winter in Europe, a drought reducing hydroelectric output in Asia, or a LNG supply disruption anywhere in the world can pull additional US gas toward export and tighten domestic supply.
The Henry Hub natural gas price is the primary US benchmark for all natural gas futures and derivatives. Henry Hub is a physical pipeline interchange located in Erath, Louisiana, where multiple interstate and intrastate pipelines meet and exchange gas. This geographic concentration of pipeline capacity makes it the most liquid delivery point in the country.
When financial media reports that natural gas is trading at a specific dollar amount per MMBtu, that figure almost always refers to the NYMEX Henry Hub front-month futures contract. Physical gas at other US delivery points trades at a spread to Henry Hub, reflecting regional supply-demand imbalances, pipeline constraints, and local weather conditions.
Over the past decade, the Henry Hub natural gas price today has ranged from below $1.50 per MMBtu, during the oversupply periods of 2020 and early 2024, to above $9.00 per MMBtu during the 2022 European energy crisis and the 2021 winter storm Uri. That range of six times the low price reflects the combination of weather-driven demand spikes and the infrastructure-constrained nature of natural gas supply responses.
Unlike oil, natural gas cannot be easily redirected to different markets by truck or tanker when pipeline capacity is insufficient. If gas cannot physically move from a production basin to a demand center, its price in that basin collapses regardless of what is happening in the broader market. This infrastructure constraint explains why Appalachian gas prices occasionally go negative during shoulder seasons when pipelines are full, even as Henry Hub trades at $2.50 or higher.
The natural gas price chart across 2025 and into 2026 tells a clear story about the structural shift in the US gas market. Understanding how to read a natural gas price chart means understanding the four-season demand cycle and how LNG exports have added a fifth variable that does not follow seasons.
| Season | Demand Driver | Typical Price Direction | What to Watch |
|---|---|---|---|
| Winter (Dec-Feb) | Heating demand peak | Price spike risk, cold weather amplifies sharply | Weather forecasts, heating degree days |
| Spring (Mar-May) | Shoulder season, low demand | Price weakness, often annual lows | Storage build rate, production trends |
| Summer (Jun-Aug) | Power generation for air conditioning | Moderate rise, heat waves add demand | Electricity demand, temperature anomalies |
| Fall (Sep-Nov) | Pre-winter storage filling | Prices firming into winter | EIA weekly storage vs five-year average |
The natural gas seasonal price pattern is more predictable than most commodities. Spring shoulder season, when both heating and cooling demand are low, tends to produce the lowest prices of the year. Winter demand for heating drives the highest prices. But weather extremes can completely override this pattern. A polar vortex in February or a record heat wave in July can double or triple natural gas price today within a week.
What the natural gas price chart 2025 showed that was different from prior years is the persistent floor under prices created by LNG export demand. Even during the mild 2025 spring shoulder season, when domestic demand was seasonally weak and storage builds were strong, Henry Hub prices did not fall to the sub-$2.00 levels seen during earlier oversupply periods. LNG exporters were absorbing supply that previously would have depressed domestic prices.
The EIA publishes the natural gas storage report weekly every Thursday morning at 10:30 AM Eastern Time. No other single data release moves the natural gas market as consistently or as sharply as this Thursday report.
The report covers three regions: the East, Midwest, and South Central (which includes the large salt cavern storage facilities of the Gulf Coast).
It reports how much gas was injected into or withdrawn from underground storage during the prior week. Traders compare the actual storage change to the consensus estimate published by financial data providers before the release.
When actual storage builds come in below the consensus estimate during the summer injection season, prices rise. The market interprets below-expected builds as a signal that demand is stronger than expected or supply is weaker, meaning winter storage levels will be tighter than forecast. When builds exceed consensus, prices typically fall.
The most useful frame for interpreting the weekly storage report is not the week-over-week change itself but the comparison between total storage and the five-year average for the same week. Storage significantly below the five-year average in October, as the injection season ends, signals potential winter supply tightness and supports higher prices. Storage significantly above the five-year average signals a well-supplied market and creates downward price pressure.
The natural gas storage report weekly also matters for understanding the pace of the injection season. If the market is on track to end the injection season below 3.5 trillion cubic feet of total storage, winter price risk increases materially. If it is heading toward 4 trillion cubic feet or above, the downside price risk from oversupply becomes the dominant concern.
US natural gas exports LNG have grown from zero in 2016 to over 14 billion cubic feet per day in 2026, making the United States the world’s largest LNG exporter. This transformation has fundamentally changed the relationship between domestic gas prices and global energy markets.
Before US LNG exports existed, Henry Hub prices were almost entirely determined by US domestic supply and demand. An oversupplied US market would see prices fall to very low levels because the gas had nowhere to go. A cold US winter would push prices sharply higher because additional imports were difficult to arrange quickly.
LNG export capacity changed that by creating a relief valve for oversupply and a new source of demand competition for tight supply. When international LNG buyers are paying high prices for gas in Asia or Europe, US exporters have an economic incentive to maximize throughput and send as much gas as possible to global markets. That reduces the domestic supply available at Henry Hub and supports domestic prices.
The LNG liquefied natural gas price in Europe and Asia, most commonly tracked through the Dutch TTF benchmark for European gas and the Japan-Korea Marker (JKM) for Asian LNG, now directly influences expectations for the natural gas price today in the United States. When European buyers are paying $10 per MMBtu equivalent or more for LNG, and Henry Hub is at $3.50, the economic incentive to maximize US exports is enormous. That price gap attracts LNG tankers and pulls US gas toward the coast.
External reference: ICE Dutch TTF Natural Gas Futures — the European benchmark for tracking global LNG price relationships.
The Europe natural gas price crisis that began in 2021 and accelerated sharply after Russia’s invasion of Ukraine in February 2022 permanently altered the global LNG market and, by extension, the natural gas price today in the United States.
Before 2022, Europe relied on Russian pipeline gas for approximately 40% of its total natural gas supply. That supply was cheap, reliable, and required no shipping infrastructure. After sanctions and the destruction of the Nord Stream pipelines, Russian gas flows to Europe fell to near zero. European utilities scrambled to replace that supply with LNG from the United States, Qatar, and Norway.
The scale of European demand for LNG in 2022 and 2023 pulled the global LNG market into extreme tightness. European spot prices reached levels above $70 per MMBtu equivalent at one point in late 2022, compared to US Henry Hub prices of around $8 to $9 per MMBtu at the same time. That price gap incentivized every available LNG tanker to deliver to Europe rather than Asia, and it incentivized US LNG exporters to run at maximum capacity.
Even as European spot prices have moderated from those extreme levels, the structural commitment to LNG imports remains locked in. Europe is building new LNG import terminals across Germany, the Netherlands, Italy, and the Baltic states. These facilities represent multi-decade commitments to LNG imports and long-term demand for US natural gas exports. The natural gas price today in 2026 reflects a market that has structurally re-priced upward from the pre-2022 floor precisely because of this European demand commitment.
Natural gas futures today live data gives a picture of what the market expects for gas prices in coming months. The NYMEX natural gas futures strip, covering contracts from one month out to several years, shows whether the market is in contango or backwardation.
When the futures curve is in contango, meaning forward prices are higher than the current spot price, the market is signaling that it expects prices to rise. This often happens during summer when storage is being filled and traders are pricing in the risk of winter tightness.
When the curve is in backwardation, meaning forward prices are lower than spot, the market expects current elevated prices to ease. This often happens during winter price spikes when traders expect cold weather to pass and prices to normalize.
For investors and analysts tracking natural gas price today, the shape of the futures curve provides context beyond the single spot price number. A steep contango in October, for example, tells you the market is genuinely concerned about winter supply adequacy. A flat or inverted curve tells you the market is comfortable with supply across the near-term horizon.
Natural gas vs coal energy price competition is one of the structural demand drivers for natural gas in the power generation sector. When natural gas prices fall relative to coal prices, power plant operators switch from coal to gas for electricity generation. This fuel-switching dynamic creates a natural demand floor for gas prices.
The economic threshold for switching varies by region and plant type, but as a rule of thumb, US power generators begin switching significantly from coal to gas when Henry Hub falls below roughly $3.00 per MMBtu. At that price, gas becomes clearly cheaper than coal on a heat-equivalent basis for most US coal plants.
This fuel-switching mechanism limits how low gas prices can fall during oversupply periods because additional power generation demand absorbs excess supply. Conversely, when gas prices rise sharply in winter, some gas-fired power generation gets displaced back toward whatever alternatives remain available, which in the US increasingly means importing power from Canada or running higher-cost peaking plants.
In 2026, natural gas vs coal energy price dynamics are less significant in the United States than they were a decade ago. The US coal fleet has shrunk dramatically as older plants have retired due to age, tightening environmental regulations, and the economics of competing against cheap gas and solar. But in Asia, where large coal fleets remain operational, gas-coal price competition continues to shape LNG demand and therefore natural gas price today indirectly.
Natural gas vs solar energy cost is the competition that will most shape natural gas demand over the coming two decades. Solar electricity generation costs have declined by more than 90% since 2010. In 2026, new utility-scale solar projects are the cheapest source of new electricity generation capacity in most regions of the United States and much of the world.
This cost decline creates a genuine structural headwind for natural gas demand in the power sector. Every megawatt of solar capacity that gets built displaces some gas-fired generation. As more solar is added to the grid, the hours per year that gas plants operate tend to decline, which reduces total gas consumption.
However, the natural gas vs solar energy cost comparison has an important dimension that pure cost figures miss: dispatchability. Solar generates electricity only when the sun is shining. Natural gas plants can generate on demand, at any hour of the day or night, in any weather. This ability to produce power exactly when needed, rather than only when conditions are favorable, is called dispatchability, and it has real economic value in a power grid.
The most likely long-term outcome for natural gas demand is a smaller but more resilient market. Total gas consumption for power generation will probably decline as solar and wind capacity grows. But the remaining gas demand will be concentrated in the peak hours and stressed grid conditions when renewables cannot generate enough power. Gas plants in that environment will be called on less frequently but will command higher prices per unit of generation. For natural gas price today and forward curves, this means a potential future of lower average prices but higher price spikes during grid stress events.
Natural gas production USA reached record levels in 2024 and 2025, driven almost entirely by the Marcellus and Utica shales of Appalachia and the associated gas produced alongside oil from the Permian Basin in Texas.
Key facts on US natural gas production:
The relationship between US natural gas production and natural gas price today is not as simple as more production equals lower prices. The LNG export outlet means that additional US production can flow out of the country rather than depressing domestic prices. And infrastructure bottlenecks in the Permian Basin, where gas is produced as a byproduct of oil drilling, can periodically push regional Permian gas prices negative even as Henry Hub trades at \$3.00 or higher.
Natural gas demand winter forecast models are among the most closely watched tools in the gas market from October onward. The two primary sources of winter demand modeling are the National Oceanic and Atmospheric Administration (NOAA) seasonal outlook and the private forecasters who track heating degree days.
A heating degree day (HDD) is a measure of how much colder a given day is than a baseline temperature of 65 degrees Fahrenheit. The more HDDs in a winter, the more natural gas gets consumed for heating. Gas market analysts convert HDD forecasts into demand projections, which they then compare against current storage levels to estimate whether winter supply will be adequate.
The basic framework: if expected winter HDDs are high (cold winter) and October storage is below the five-year average, the market is at risk of supply tightness and price spikes. If expected winter HDDs are near normal and storage is near or above average, the market should handle winter demand without extreme price pressure.
What makes natural gas demand winter forecast analysis genuinely useful is tracking how forecasts evolve. A winter that starts in November with normal temperature outlooks and then shifts to above-normal cold in December can produce very sharp price rallies because the market had not priced in the cold. The velocity of forecast revisions matters as much as the absolute forecast level.
Natural gas price volatility is significantly higher than almost any other major commodity. The annualized volatility of front-month Henry Hub futures contracts is typically in the range of 50% to 90% in normal years. During weather extremes, realized volatility can spike to 200% or higher on an annualized basis.
For comparison, crude oil typically trades with annualized volatility in the 25% to 40% range. Gold is usually in the 12% to 20% range. Natural gas is in a category of its own for commodity volatility.
Why is natural gas price volatility so extreme? Three structural reasons:
Inelastic short-term demand. When temperatures plunge, people need heat. They cannot easily reduce gas consumption in winter regardless of price. This inelastic demand means prices must move sharply to balance supply and demand when there is a shortage.
Limited storage relative to demand. Total US natural gas storage capacity of roughly 4 to 4.5 trillion cubic feet represents only about 40 to 50 days of total consumption at peak winter demand rates. A sustained cold snap can draw down this buffer quickly, leading to sharp price increases as storage gets depleted.
Pipeline infrastructure constraints. Natural gas cannot be quickly redirected when pipelines are full. Regional supply shortfalls cannot be solved overnight regardless of price signals.
Also Read This
Fintechzoom’s 2026 Tesla Stock Guide breaks down TSLA’s volatile 2025 ride, delivery records, FSD/robotaxi momentum, and energy-storage wins, while sizing up fierce EV competition, margin pressures, and macro risks.
With analyst consensus, valuation snapshots, and pro-grade charting tools, it’s a sharp, data-driven playbook for growth investors betting on Tesla’s shift beyond cars into autonomy and robotics.
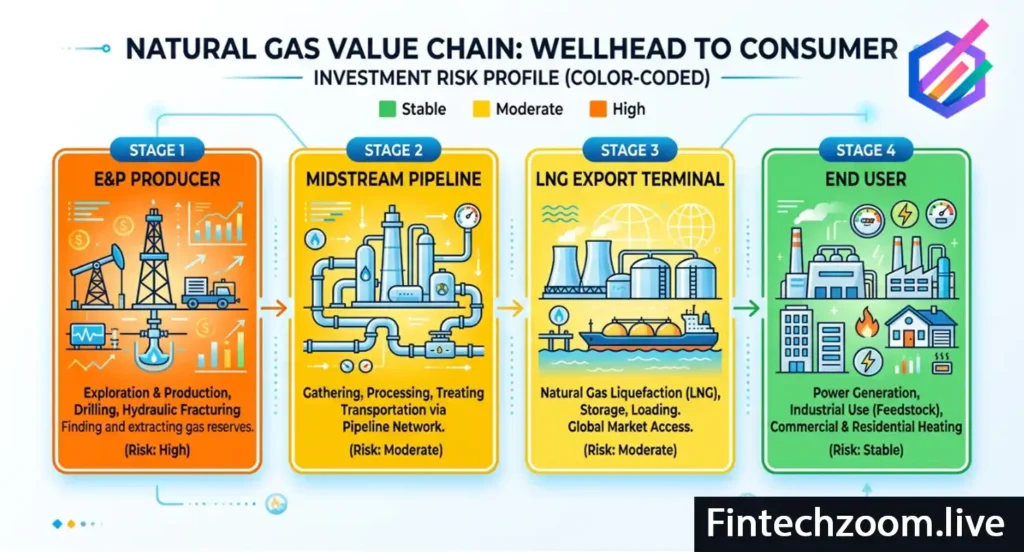
Natural gas stocks 2025 offer several different ways to invest in the natural gas market, each with a distinct risk and return profile depending on where in the value chain the company operates.
| Company Type | Examples | Price Driver | Income Profile |
|---|---|---|---|
| E&P Producers | EQT Corp, Coterra Energy, Range Resources | Henry Hub gas price, production volumes | Variable, tied directly to gas price |
| LNG Exporters | Cheniere Energy, New Fortress Energy | LNG contract prices, utilization rates | Mostly fixed-fee long-term contracts |
| Midstream Pipelines | Williams Companies, Kinder Morgan | Fee-based volume throughput | Stable, fee income largely independent of gas price |
| Utilities | Atmos Energy, Spire Inc | Regulated rates, distribution volume | Stable, regulated utility-style returns |
E&P producers give you the most direct exposure to natural gas price today. When Henry Hub rises, producer revenues and earnings increase proportionally. When gas prices fall, producers are directly hurt. EQT Corporation, the largest US natural gas producer by volume, is the most common vehicle for direct gas price exposure among large-cap stocks.
LNG exporters offer a different risk profile. Cheniere Energy, the largest US LNG exporter, operates under long-term fixed-fee contracts that insulate most of its revenue from spot gas price movements. Cheniere earns a fee for liquefying and exporting gas regardless of whether Henry Hub is at $2.00 or $5.00 per MMBtu. This makes LNG exporter stocks attractive for investors who want exposure to growing US LNG export volumes without taking on the full volatility of commodity price swings.
Midstream pipeline companies like Williams Companies and Kinder Morgan earn fees based on the volume of gas that flows through their pipelines and processing facilities. Their revenues are largely independent of the actual price of natural gas. Midstream stocks tend to offer more stable dividends and lower price volatility than producers or LNG stocks, making them suitable for income-oriented investors who want some connection to natural gas market growth without direct commodity exposure.
Utilities that distribute natural gas to homes and businesses, such as Atmos Energy and Spire, operate in regulated markets where rate structures allow them to pass through commodity price changes to customers. This means they bear minimal gas price risk but also have limited upside from price increases. Utility stocks in this sector are primarily income vehicles.
Disclaimer: Natural gas ETFs that hold futures contracts face contango-related roll costs that can significantly reduce returns over time compared to spot price movements. Understand the mechanics of any ETF before investing.
External reference: Federal Energy Regulatory Commission — LNG project approvals and natural gas infrastructure data.
A practical natural gas market analysis today starts with monitoring a short list of data points that collectively tell you where supply, demand, and sentiment stand:
Weekly EIA storage report: The single most important weekly data point. Released every Thursday at 10:30 AM Eastern. Compare actual storage change to consensus estimate and track total storage against the five-year average.
Current production levels: The EIA also tracks weekly dry gas production estimates. Rising production during warm weather is a bearish signal for prices.
LNG export nominations: Daily LNG feed gas nominations to US export terminals, published by pipeline data services, show how much gas is being pulled toward export. High nominations tighten domestic supply and support prices.
Weather forecasts: The 6-10 day and 8-14 day NOAA temperature outlook, updated twice per week, drives short-term price expectations more directly than almost any other factor.
Rig count: The Baker Hughes weekly natural gas-directed rig count shows how many rigs are drilling for gas. Falling rig counts signal future production declines, which is a bullish medium-term indicator. Rising counts signal future supply growth.
Tracking these five metrics on a regular basis gives you the informational foundation for understanding why the natural gas price today is at its current level and what direction the near-term risks are skewed toward.
The natural gas price forecast 2025 heading into 2026 reflected a market balanced between record production and record LNG export demand. Analyst forecasts for Henry Hub in 2026 generally clustered in the $3.00 to $4.50 per MMBtu range for average annual prices, with significant upside risk in winter months if temperatures ran cold and downside risk in shoulder seasons if production continued at record levels.
The key swing factors for the natural gas price forecast 2026 are:
New LNG export capacity. Several new LNG export trains were scheduled to begin operations in 2025 and 2026, adding demand for additional feed gas. As those facilities ramp up, they pull incremental supply from the domestic market and support prices.
Permian Basin associated gas growth. If oil production in the Permian continues to grow, the associated natural gas produced alongside oil will continue to rise, adding supply that may not be fully absorbed by LNG exports.
Winter weather realization. Weather remains the single biggest wildcard. A cold winter versus a mild winter can move the annual average Henry Hub price by $1.00 per MMBtu or more in either direction.
European LNG demand sustainability. If European energy policy shifts or if new pipeline supply from non-Russian sources comes online, European LNG demand could moderate, reducing the pull on US exports.
What is the natural gas price today in 2026? The natural gas price today is quoted in real-time through NYMEX Henry Hub futures contracts. As a benchmark, Henry Hub prices in early 2026 have traded primarily in the $3.00 to $4.50 per MMBtu range, though daily moves can be significant. Check the EIA website or financial data platforms for the current live price.
Why did the natural gas price rise so much in 2022? The 2022 surge in natural gas price reflected the European energy crisis following the reduction of Russian pipeline gas supplies to Europe. European buyers competed aggressively for global LNG cargoes, pulling US exports higher and tightening domestic supply at a time when US storage was already below the five-year average.
How does the EIA storage report affect natural gas price today? The weekly EIA natural gas storage report compares actual underground storage changes to market consensus expectations. When storage builds are below expectations, prices typically rise. When builds exceed expectations, prices typically fall. The effect is strongest when total storage is significantly above or below the five-year seasonal average.
What is the best natural gas stock for direct price exposure? E&P producers like EQT Corporation, Coterra Energy, and Range Resources offer the most direct correlation to natural gas price today. Their revenues rise and fall with Henry Hub prices. LNG exporters like Cheniere Energy offer exposure to export volume growth with lower direct commodity price sensitivity.
How does LNG affect the natural gas price today? US LNG exports create a link between Henry Hub prices and global LNG prices. When global LNG prices are high relative to Henry Hub, exporters pull more US gas toward the coast for export, reducing domestic supply and supporting Henry Hub prices. This mechanism means that events in Europe and Asia now have a direct effect on the natural gas price today in the United States.
What drives natural gas price volatility? Natural gas price volatility is driven primarily by short-term weather shocks, the relative tightness or looseness of underground storage, and pipeline infrastructure constraints that prevent rapid supply redistribution. LNG export demand adds a global dimension that can amplify or dampen domestic price moves.
Also Read This
FintechZoom’s Intel Stock 2026 guide breaks down INTC’s high-stakes turnaround in AI PCs, Gaudi inference chips, and the 18A foundry bet, with 2025 recovery signals but ongoing share losses to AMD and NVIDIA.
Analysts’ bull-to-bear targets range $45–55 to $18–22; verdict is hold with speculative buy lean for patient growth investors chasing catalysts while bracing for execution risks.

Curated Editorial Insights Across FintechZoom’s Core Verticals: Thought-provoking analysis in Markets, Business Strategy, Crypto Innovation, Personal Finance, Economic Policy, and Lifestyle Wealth, designed to challenge conventional thinking, deepen financial literacy, and empower readers to make smarter, forward-looking decisions.
FintechZoom.Live is your real-time gateway to smarter investing, delivering instant stock market updates, expert analysis, and actionable insights on the stocks that matter most. From Magnificent 7 giants like NVIDIA, Microsoft, and Tesla to high-momentum meme stocks like GameStop and AMC, we cover the full spectrum of opportunities with zero-delay reporting. Our platform specializes in low-competition, high-value SEO content clusters, prioritizing “buy or sell” decision guides, price predictions, and forecast analysis for retail and institutional investors alike. Whether you’re tracking EV disruptors Lucid and Rivian, AI leaders Palantir and C3.ai, or legacy dividend plays like Ford and IBM, FintechZoom.Live provides semantic-rich, data-driven coverage optimized for search visibility and investor clarity. With 50+ stock clusters, 500+ semantic keywords, and real-time market intelligence, we empower you to make informed decisions before the market moves. Your edge starts here live.
Disclaimer
The information provided on FintechZoom.Live is for informational purposes only and should not be considered financial or investment advice. Investing in cryptocurrencies, digital assets, or any financial product involves significant risk, including the potential loss of your entire investment. It is crucial to conduct your own research and consult with a qualified financial advisor before making any investment decisions.
FintechZoom.Live does not endorse any specific investment or financial product. We are not responsible for any losses or damages incurred as a result of using the information on our website.
Please be aware that the regulatory landscape for cryptocurrencies and digital assets is complex and varies across jurisdictions. It is important to understand the applicable regulations in your location before investing.
For further information on U.S. regulations, you may refer to the following resources:
Securities and Exchange Commission (SEC): https://www.sec.gov/
Commodity Futures Trading Commission (CFTC): https://www.cftc.gov/
Financial Crimes Enforcement Network (FinCEN): https://www.fincen.gov/
By using FintechZoom.Live, you acknowledge and agree to this disclaimer.

Your trusted source for stocks, crypto, commodities, and fintech news. Track live prices, explore market trends, and make informed financial decisions with data that moves as fast as the markets.