
Gold price today stands at approximately $4,517 per troy ounce as of June 1, 2026 — down from the all-time record high of $5,602.22 set on January 28, 2026, but still up more than 34% compared to the same date in 2025. Whether you are tracking the live spot price, planning a position in gold ETFs, or reading the macro picture behind the recent pullback, this page gives you the full picture: current prices in every unit, the key drivers moving the market right now, an up-to-date 2026 forecast table from major banks, and a clear framework for deciding how gold fits your portfolio.
Disclaimer: Gold prices are volatile. This page is for educational and informational purposes only and does not constitute investment advice. Always consult a qualified financial adviser before making investment decisions.
Gold price today is quoted in troy ounces globally, but retail buyers and jewellery markets also use grams, kilograms, and region-specific units. The table below shows the key conversions based on a reference spot price of approximately $4,517/oz (June 1, 2026, refresh for the latest live data via the embedded chart).
| Unit | Price (USD) | Notes |
|---|---|---|
| Troy ounce | ~$4,517 | Global standard; futures, ETFs, wholesale |
| Gram (31.1g = 1 troy oz) | ~$145.24 | Used in retail, jewellery |
| Kilogram | ~$145,240 | Large bar wholesale standard |
| Pennyweight (DWT) | ~$225.85 | Used in US jewellery trade |
| Tola (11.66g) | ~$1,693.42 | Common in South Asia |
One troy ounce equals 31.1035 grams this conversion matters when comparing jewellery prices, which are usually quoted per gram, to spot prices quoted per ounce.
For the live bid/ask spread, the current market shows a typical spread of $2–$3/oz on spot gold, which is tight relative to physical premiums of $30–$80/oz you would pay for coins or bars from a dealer.
Gold price today is shaped by four primary forces. Three of those four are currently pointing in the same direction: up. Understanding each force separately is how you read the chart like a professional rather than reacting to daily headlines.
The formula is simple: real interest rate = nominal rate minus inflation. When that number turns negative, gold becomes far more attractive because you give up almost nothing by holding a non-yielding asset.
In 2026, the Federal Reserve has paused its cutting cycle. Markets have fully priced out rate cuts for the rest of the year, and some futures traders are pricing in a hike before year-end. Core CPI is running near 3.5% against a 10-year Treasury yield near 4.5%, which leaves real rates barely positive, roughly +1%. That is not the deeply negative environment of 2020–2022, but it is far from the aggressively positive real rate environment that would crush gold.
Stagflation parallels are drawing increasing attention from analysts. As CBS News reported in late May 2026, one analyst described the setup as potentially “a lot like the stagflation of the 70s and 80s, which were also really, really good for gold.” In that decade, gold rose from roughly $35/oz in 1971 to over $800/oz by 1980.
Central banks purchased over 1,100 tonnes of gold in 2025 the third consecutive year above the 1,000-tonne threshold, according to World Gold Council data. The primary buyers are the People’s Bank of China, the Reserve Bank of India, the National Bank of Poland, and the central banks of Turkey, Kazakhstan, and the UAE.
The catalyst for this structural shift was the freezing of approximately $300 billion in Russian foreign exchange reserves by Western governments in 2022. The message resonated globally: dollar reserves held abroad can be immobilized by a foreign government’s decision. Gold stored in a sovereign vault cannot. This is not a cyclical trade, it is a long-duration reserve strategy with years of runway remaining.
Central banks are price-insensitive buyers. They are not trading for short-term gains. When gold pulls back 15–20%, central banks step in as buyers of last resort, which is exactly the pattern observed during the May 2026 selloff that briefly pushed spot prices to $4,380.
Gold is priced in US dollars globally. The relationship is mechanical and inverse: a stronger dollar reduces purchasing power for non-dollar buyers, which suppresses demand from Europe, Asia, and the Middle East. A weaker dollar has the opposite effect.
In 2026, the dollar has shown periods of strength driven by the repricing of Fed expectations. This is the one driver that has worked against gold price today in the past few months. However, JPMorgan’s year-end target of $6,300/oz is partly premised on a weaker dollar in the second half of 2026, as fiscal deficit concerns and the structural de-dollarization trend reassert themselves.
Watch the DXY index (the ICE Dollar Index) as a proxy for dollar direction. A DXY below 100 has historically been supportive of gold; a DXY above 106 typically creates near-term headwinds.
Safe-haven demand is the most visible but least predictable driver of gold price today. It spikes in response to specific catalysts and fades when conditions stabilize. In 2026, the geopolitical backdrop remains elevated on multiple fronts.
US-Iran tensions have been a recurring theme throughout the year. In late May 2026, fresh military tensions pushed the dollar sharply higher and briefly hit gold, with spot prices touching $4,380 on May 28. By May 29, gold staged a decisive rebound above $4,500 after April PCE inflation data came in broadly in line with expectations. As of June 1, the two sides remain in ceasefire negotiations, with President Trump pressing for Iran to halt nuclear activities and restore the Strait of Hormuz as an open international waterway, an unresolved situation that keeps safe-haven demand active.
| Driver | How It Affects Gold | 2026 Status | Net Impact |
|---|---|---|---|
| Real interest rates | Negative rates = bullish | Near zero, ~+1% real rate | Neutral to mildly supportive |
| Central bank buying | Volume buying = price floor | 1,100+ tonnes/year | Strongly supportive |
| US Dollar (DXY) | Weaker dollar = bullish | Moderate strength | Near-term headwind |
| Geopolitical risk | Higher risk = safe-haven bids | Elevated (US-Iran, Middle East) | Supportive |
Understanding where gold price today sits requires perspective on the full cycle. Gold traded below $300/oz as recently as 2002. It crossed $1,000 for the first time in 2008. It reached $1,900 during the 2011 inflation scare, then spent nearly a decade trading sideways.
The current bull market began when gold set a new high of $2,074 on August 7, 2020, driven by COVID-19 economic uncertainty, near-zero interest rates, and a weakening dollar. Key milestones since then:
The 2026 correction from $5,602 to ~$4,517 represents a drawdown of approximately 19%. For context, gold’s major corrections within secular bull markets have historically ranged from 15% to 40%. This pullback is well within normal parameters for the asset class.
| Year | Annual Average Price/Oz | Annual Average Price/Gram |
|---|---|---|
| 2020 | $1,769 | $56.88 |
| 2022 | $1,800 | $57.87 |
| 2024 | $2,386 | $76.71 |
| 2025 | $3,431 | $110.32 |
| 2026 YTD | ~$4,750 (avg.) | ~$152.72 |
The consensus among major financial institutions is that the current pullback is a buying opportunity, not a trend reversal. Here is the current forecast landscape as of June 2026:
| Institution | 2026 Year-End Target | Key Rationale |
|---|---|---|
| JP Morgan | $6,300/oz | Central bank demand, ETF inflows, weaker dollar H2 |
| Bank of America | $6,000/oz | Fed leadership uncertainty, low investor gold allocation |
| Wells Fargo Investment Institute | $6,100–$6,300 | Structural de-dollarization, geopolitical premium |
| Goldman Sachs | $5,000–$5,400 (revised upward) | Continued central bank buying pace |
| UBS | $5,900 | Central bank buying + stagflation risk + geopolitical tension |
| RBC Capital Markets | $5,723 | Broad macro tailwinds intact |
| Morgan Stanley | Bullish | Investor diversification builds |
The broad range reflects genuine uncertainty around Federal Reserve policy and the trajectory of the US-Iran situation. However, even the most conservative major-bank forecasts see gold holding above $5,000 by year-end, implying meaningful upside from the June 1 price of ~$4,517.
Bear case (20% probability per analyst consensus): A scenario where gold falls to the $3,900–$4,300 range requires rapid disinflation, a Fed rate hike cycle, geopolitical de-escalation across multiple fronts, and a strong DXY. All of these conditions reversing simultaneously is historically rare.
Gold’s reputation as an inflation hedge is real, but nuanced. Over very long periods,decades, gold has preserved purchasing power better than cash. The post-1971 data, since the US dollar was fully removed from gold backing, broadly supports this.
Over shorter periods, the correlation is inconsistent. In the 1970s, gold famously delivered massive real returns during high inflation. In the 2021–2022 inflation surge, gold was notably flat to down while inflation ran above 8%, one of the worst short-term correlations on record for the inflation hedge thesis.
What 2026 adds to this picture is the stagflation angle. Stagflation, rising inflation combined with stagnating growth, is the environment where gold historically shines most consistently. Q4 2025 GDP growth has slowed to an annualized 0.7%, while inflation remains above the 2% target. With markets now pricing out rate cuts and some traders watching for potential hikes, the “trapped Fed” scenario described by multiple analysts in late May 2026 creates exactly the kind of macro tension that historically benefits gold regardless of whether inflation is accelerating or simply sticky.
For a practical portfolio allocation framework, most institutional portfolios use gold as 5–10% of total assets as a non-correlated hedge rather than a pure inflation play. The more modest goal, reducing portfolio volatility and providing a store of value during risk-off episodes, is where gold’s track record is most reliable.
The right method depends on your holding period, tax situation, capital size, and preference for physical ownership.
Gold ETFs are exchange-traded funds backed by physical gold held in institutional vaults. They trade on stock exchanges exactly like shares, require no storage arrangements, and offer instant liquidity during market hours.
The four main options in 2026:
| ETF | Expense Ratio | AUM | Best For |
|---|---|---|---|
| GLD (SPDR Gold Shares) | 0.40% | ~$158 billion | Active traders, institutional size |
| IAU (iShares Gold Trust) | 0.25% | Large | Long-term buy-and-hold investors |
| GLDM (SPDR Gold MiniShares) | 0.10% | ~$25+ billion | Cost-conscious long-term holders |
| BAR (GraniteShares) | 0.17% | Smaller | Lowest-cost established option |
Key tax consideration: Physical gold ETFs are taxed as collectibles in the US at a maximum federal rate of 28%, regardless of holding period, higher than the 20% long-term capital gains rate that applies to equity ETFs. Confirm with a tax professional before deciding whether to hold in a taxable account or an IRA.
All four ETFs listed above qualify for IRAs, making the tax treatment issue moot if you are investing through a retirement account.
Physical gold gives you direct ownership of the metal, free from counterparty risk. The tradeoff is the premium over spot price (typically $30–$80/oz for 1-oz coins like American Eagles or Maple Leafs), plus ongoing storage costs if you use a professional vault.
For smaller purchases, a 1-gram gold bar typically carries a much higher percentage premium over spot than a 1-oz coin, making coins the better value for incremental buyers. The 1-oz American Gold Eagle and Canadian Gold Maple Leaf are the most liquid products in the secondary market.
Gold mining stocks (via individual companies or ETFs like GDX and GDXJ) provide leveraged exposure to gold price today. When gold rises 10%, mining stocks frequently rise 20–30% due to operating leverage. The downside mirrors this leverage: mining stocks fell significantly more than spot gold during the 2026 correction.
Mining stocks add company-specific risk, operational, political, management, that pure gold exposure does not. They are appropriate for investors who want amplified upside and understand the additional risk layer.
Futures on COMEX (CME Group) are the institutional standard for gold price discovery. For most retail investors, futures involve leverage, margin calls, and rollover costs that create complexity beyond what a physical ETF provides. CFDs (contracts for difference) are available through forex and CFD brokers but carry significant leverage risk and are banned for US retail clients. Neither instrument is recommended for investors whose primary goal is portfolio diversification or inflation hedging.
Also Read This:
Boeing’s 4,000+ aircraft backlog signals huge 2026 upside, yet pandemic debt, production bottlenecks, and Airbus competition keep BA stock volatile, Fintechzoom delivers clear price targets ($220 consensus), earnings calendar, and a practical buy/hold/sell framework for investors eyeing the aerospace recovery.
The global gold price is determined by two interconnected markets: the London Bullion Market Association (LBMA) and the COMEX in New York.
The LBMA runs the twice-daily London Gold Price benchmark, the official fix that many institutional contracts, central bank purchases, and ETF valuations reference. The morning fix occurs at 10:30 AM London time; the afternoon fix at 3 PM London time. Both are run via an electronic auction overseen by the ICE Benchmark Administration.
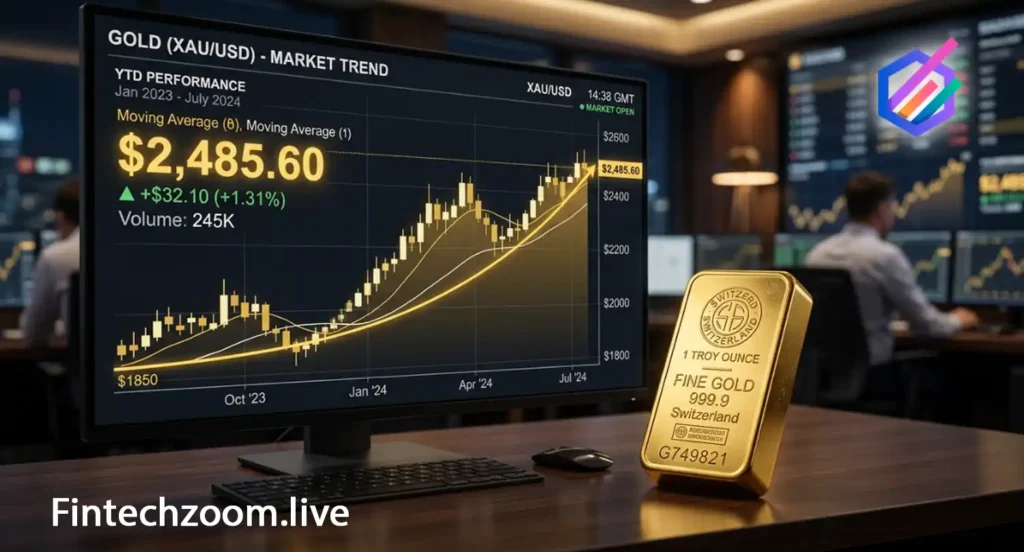
COMEX runs continuous futures trading based on 100-troy-ounce contracts. Futures prices are typically slightly above or below spot depending on the term structure — the gold futures market is normally in slight contango (futures above spot) due to storage and financing costs. The spot price you see on live charts is derived from the front-month futures contract with carry costs adjusted out.
Arbitrage between London and New York keeps the two markets tightly linked. Price discrepancies of more than $1–$2/oz typically trigger immediate algorithmic arbitrage trades that close the gap within seconds.
The gold-to-silver ratio (how many ounces of silver it takes to buy one ounce of gold) is a widely watched relative value metric. At current prices, gold near $4,517/oz and silver near $74/oz, the ratio sits near 61:1. Historically, the ratio has ranged from 30:1 (silver relatively expensive) to 120:1 (silver relatively cheap). A ratio above 70:1 is generally viewed as a signal that silver offers better relative value.
Platinum at approximately $1,923/oz is currently trading at a steep discount to gold, a ratio of about 2.35:1. Platinum historically traded at a premium to gold for most of the 20th century. The current inversion reflects weaker automotive catalyst demand (platinum’s largest industrial use) as electric vehicle adoption reduces internal combustion engine production.
For investors focused on gold price today as a monetary asset, silver and platinum serve different purposes: silver has a larger industrial demand component (55–60% of annual demand), and platinum is primarily an industrial metal with monetary overlap.
What is the gold price today per ounce? Gold price today is approximately $4,517.37 per troy ounce as of June 1, 2026, according to spot market data. The price updates continuously during trading hours across the LBMA in London and COMEX in New York. Check the live chart widget on this page for real-time data.
Why did gold hit an all-time high in January 2026? Gold reached its all-time record of $5,602.22 on January 28, 2026. The surge was driven by massive ETF inflows, record central bank gold purchases, a weakening US dollar during early 2026, and heightened macro uncertainty around US trade and fiscal policy. Gold set 53 new all-time highs during 2025 before reaching the January 2026 peak.
Why has gold pulled back from its all-time high? From the January 2026 peak of $5,602 to the June 1 price of ~$4,517, gold has corrected approximately 19%. The pullback reflects markets fully pricing out Federal Reserve rate cuts for 2026 (some futures even price a rate hike), bond yields climbing, and the US dollar strengthening against major currencies. These conditions raise the opportunity cost of holding non-yielding gold.
Will gold reach $6,000 per ounce in 2026? Multiple major financial institutions have set year-end 2026 targets in the $5,900–$6,300 range, including JP Morgan ($6,300), Bank of America ($6,000), Wells Fargo ($6,100–$6,300), and UBS ($5,900). These forecasts are premised on continued central bank buying, persistent inflation above the Fed’s 2% target, and a weaker dollar in the second half of the year. No major forecaster has turned outright bearish on gold at current prices.
What is gold price today per gram in USD? At a spot price of ~$4,517/oz, gold price today per gram is approximately $145.24. One troy ounce contains exactly 31.1035 grams. The per-gram price is most relevant for retail jewellery purchases and small investment bars. Note that when buying physical gold by the gram, the premium over spot (dealer markup) as a percentage is much higher than when buying a full ounce.
Is now a good time to buy gold? This is a financial decision that depends on your individual circumstances, investment objectives, and time horizon. From a market structure standpoint, the current price (~$4,517) represents approximately a 19% discount from the January 2026 all-time high. Major bank forecasters see meaningful upside to year-end. Structural drivers, central bank buying, negative-to-near-zero real rates, de-dollarization, remain intact. However, gold does not pay dividends or income, and short-term volatility can be significant. Consult a qualified financial adviser before making investment decisions.
What is the difference between spot price and the price I pay for physical gold? The spot price is the theoretical price for immediate delivery of one troy ounce of gold in the wholesale interbank market. Physical gold retail products (coins, bars) trade at a premium above spot, typically $30–$80/oz for popular 1-oz coins, and higher percentage premiums for fractional sizes. This premium covers minting, fabrication, distribution, and dealer margin. When you sell physical gold, you typically receive spot minus a small discount. Gold ETFs effectively eliminate this spread for investors who do not need the physical metal.
What is the LBMA Gold Price and how does it differ from spot price? The LBMA Gold Price is a formally published benchmark set twice daily (10:30 AM and 3 PM London time) by an electronic auction overseen by ICE Benchmark Administration. It is used as the reference price for a large proportion of institutional gold transactions, ETF valuations, and mining company contracts. The spot price that you see on live charts is the continuously traded market price and is typically very close to the most recent LBMA fix, with minor discrepancies closing quickly through arbitrage.
How does the Federal Reserve affect gold price today? Federal Reserve policy affects gold primarily through its impact on real interest rates and the US dollar. When the Fed cuts rates, nominal yields fall. If inflation stays elevated, real rates turn negative, historically the most supportive environment for gold. When the Fed raises rates or signals tightening, real rates rise and the dollar typically strengthens, creating headwinds for gold. In 2026, the Fed’s pause has been partially offset by the persistence of above-target inflation, leaving the net impact relatively neutral but with the balance of risks tilted toward eventual easing.
Is gold a good inflation hedge? Gold’s performance as an inflation hedge is strongest over long periods (decades) and in stagflationary environments. Over shorter periods, the correlation is unreliable, gold was flat to down during the 2021–2022 high inflation surge. In 2026, the stagflation scenario (sticky inflation plus slowing growth) is regarded by several analysts as the environment most favourable to gold, consistent with the 1970s precedent when gold rose from approximately $35/oz to over $800/oz. As a portfolio hedge against inflation eroding purchasing power over many years, gold has a solid long-run record. As a short-term inflation trade, results vary significantly.
Also Read This
FintechZoom’s Intel Stock 2026 guide breaks down INTC’s high-stakes turnaround in AI PCs, Gaudi inference chips, and the 18A foundry bet, with 2025 recovery signals but ongoing share losses to AMD and NVIDIA.
Analysts’ bull-to-bear targets range $45–55 to $18–22; verdict is hold with speculative buy lean for patient growth investors chasing catalysts while bracing for execution risks.

Curated Editorial Insights Across FintechZoom’s Core Verticals: Thought-provoking analysis in Markets, Business Strategy, Crypto Innovation, Personal Finance, Economic Policy, and Lifestyle Wealth, designed to challenge conventional thinking, deepen financial literacy, and empower readers to make smarter, forward-looking decisions.
FintechZoom.Live is your real-time gateway to smarter investing, delivering instant stock market updates, expert analysis, and actionable insights on the stocks that matter most. From Magnificent 7 giants like NVIDIA, Microsoft, and Tesla to high-momentum meme stocks like GameStop and AMC, we cover the full spectrum of opportunities with zero-delay reporting. Our platform specializes in low-competition, high-value SEO content clusters, prioritizing “buy or sell” decision guides, price predictions, and forecast analysis for retail and institutional investors alike. Whether you’re tracking EV disruptors Lucid and Rivian, AI leaders Palantir and C3.ai, or legacy dividend plays like Ford and IBM, FintechZoom.Live provides semantic-rich, data-driven coverage optimized for search visibility and investor clarity. With 50+ stock clusters, 500+ semantic keywords, and real-time market intelligence, we empower you to make informed decisions before the market moves. Your edge starts here live.
Disclaimer
The information provided on FintechZoom.Live is for informational purposes only and should not be considered financial or investment advice. Investing in cryptocurrencies, digital assets, or any financial product involves significant risk, including the potential loss of your entire investment. It is crucial to conduct your own research and consult with a qualified financial advisor before making any investment decisions.
FintechZoom.Live does not endorse any specific investment or financial product. We are not responsible for any losses or damages incurred as a result of using the information on our website.
Please be aware that the regulatory landscape for cryptocurrencies and digital assets is complex and varies across jurisdictions. It is important to understand the applicable regulations in your location before investing.
For further information on U.S. regulations, you may refer to the following resources:
Securities and Exchange Commission (SEC): https://www.sec.gov/
Commodity Futures Trading Commission (CFTC): https://www.cftc.gov/
Financial Crimes Enforcement Network (FinCEN): https://www.fincen.gov/
By using FintechZoom.Live, you acknowledge and agree to this disclaimer.

Your trusted source for stocks, crypto, commodities, and fintech news. Track live prices, explore market trends, and make informed financial decisions with data that moves as fast as the markets.