Bonds & Rates

Treasury Bond

Treasury Bond Rates Today: Live Yields, 2026 Forecast & Best Bonds to Buy for Smarter Investing

Treasury bond rates today reflect a market in transition, with the 10-year yield hovering near 4.34%, the 2-year at approximately 3.84%, and the 30-year long bond around 4.91% as of April 11, 2026. These elevated rates represent the culmination of Federal Reserve tightening, persistent inflation concerns, and record-breaking sovereign debt issuance that now exceeds $17 trillion annually across OECD nations. FintechZoom.Live provides real-time monitoring of these yields alongside actionable signals for retail investors seeking income without equity volatility.

Bond Market Today Live – What the Numbers Actually Mean Right Now

Current Treasury yields reflect a complex interplay of monetary policy expectations, fiscal supply dynamics, and global safe-haven demand. The 10-year Treasury yield at 4.34% represents the risk-free rate against which all other investments benchmark. This level sits approximately 60 basis points above the effective federal funds rate, indicating modest curve steepening that historically correlates with economic expansion expectations.
The yield curve status shows meaningful steepening compared to 2024 inversion patterns. According to OECD Global Debt Report 2026 data, 30-year yields increased in 21 of 23 OECD countries during 2025, with the median rising from 3.2% to 4.1%. This long-end pressure stems from increased supply, quantitative tightening effects, and higher risk perceptions among institutional investors. Short-term yields have stabilized near 2.5% median across OECD nations, creating the steepest curves since pre-pandemic periods.
Corporate versus government bond spreads remain near historic lows despite elevated issuance volumes. Corporate borrowing reached $13.7 trillion in 2025, surpassing the 2021 peak, yet credit spreads have tightened reflecting improved market sentiment and strong corporate fundamentals. Investment-grade corporate bonds offer 80-150 basis points over comparable Treasuries, while high-yield issues provide 300-450 basis point spreads for risk-tolerant investors.
Comparison table of current rates (April 2026):
  • 10-Year Treasury: 4.34% (benchmark for mortgages and corporate debt)
  • 2-Year Treasury: 3.84% (sensitive to Fed policy expectations)
  • 30-Year Treasury: 4.91% (long-duration, inflation-sensitive)
  • Series I Savings Bonds: 4.03% (inflation-protected, tax-deferred)
  • Series EE Savings Bonds: 2.50% (fixed rate, guaranteed doubling in 20 years)
  • Investment-Grade Corporate: 5.20-5.80% (spread over Treasuries)
  • High-Yield Corporate: 7.50-9.00% (credit risk premium included)

Treasury Bond Rates Today | US 10 Year Treasury Yield Today & Fed Interest Rate Decision Impact

The 10-year Treasury yield serves as the economy’s most important interest rate benchmark, influencing everything from mortgage rates to stock valuations. Current movements reflect market expectations for Federal Reserve policy trajectory through 2026. The CBO projects the 10-year rate averaging 4.1% in 2026, with potential volatility driven by geopolitical developments and debt supply concerns.
Treasury yield curve steepening 2024 to 2026 comparison
Federal Reserve interest rate decisions in 2026 follow a scheduled eight-meeting calendar: January 28-29, March 17-18, April 28-29, June 16-17, July 28-29, September 15-16, October 27-28, and December 9-10. Markets expect the Fed to maintain the federal funds rate at 3.50-3.75% through mid-2026 before gradual reductions toward 3.00-3.25% by year-end. This path depends on inflation trajectory, employment stability, and global financial conditions.
The transmission mechanism from Fed decisions to household finances operates through multiple channels. Treasury yields directly determine 30-year fixed mortgage rates, currently hovering near 6.8-7.2%. Auto loan rates track 2-5 year Treasury yields plus risk spreads, placing new car financing at 6.5-8.5%. Corporate borrowing costs for investment-grade issuers range from 5.0-6.5%, affecting capital expenditure decisions and share buyback programs for companies like Apple and Microsoft.
Recent developments including Middle East tensions and trade policy uncertainty have increased yield volatility. The Federal Reserve minutes indicate that upside risks to inflation and downside risks to employment remain elevated, with policymakers signaling potential for additional rate increases if inflation persists above target levels. This two-sided risk framework creates uncertainty requiring active portfolio management.

Treasury Bond Rates Today 2026–2027 Forecast – Price Predictions & Scenarios

Consensus forecasts from major institutions suggest Treasury yields will remain elevated but range-bound through 2026. Wells Fargo and Transamerica outlooks project 10-year yields between 4.00-4.50% by year-end 2026, with the CBO forecasting a gradual rise to 4.3% by 2027. This environment favors income generation but requires careful duration management to protect against price declines if rates rise further.
The bull case scenario involves deeper Federal Reserve cuts driven by economic slowdown or inflation normalization. If the Fed reduces rates toward 2.50-3.00% neutral levels, 10-year yields could fall below 3.75%, generating significant price appreciation for long-duration bonds. This outcome favors Treasury bonds with 10+ year maturities and investment-grade corporate issues with long durations.
The base case soft-landing scenario assumes moderate economic growth with gradual Fed easing. Under these conditions, yield curve steepening continues with short-term rates declining while long-term rates remain stable or rise modestly. Intermediate-term Treasuries (5-10 year maturities) offer the optimal risk-reward balance, providing yield pickup over cash while limiting duration exposure.
The bear case scenario features sticky inflation or debt supply concerns pushing yields back toward 4.5-4.8% levels. In this environment, short-term Treasury bills and floating-rate instruments outperform as they reset to higher rates without significant principal loss. The OECD notes that interest payments will increase the debt-to-GDP ratio by 2.5 percentage points in 2026, potentially exacerbating supply concerns.
Magnificent 7 stock valuations demonstrate inverse correlation with Treasury yields. Lower yields support higher price-to-earnings multiples for growth stocks like NVIDIA and Tesla by reducing discount rates on future cash flows. Conversely, rising yields compress these multiples and redirect investor capital toward fixed-income alternatives. This relationship demands coordinated monitoring of bond and equity positions.
Bond ladder strategy with Treasury securities

Treasury Bond Rates Today in 2026 – Actionable “Buy or Sell” Guide

Top bond ETF selections for 2026 focus on duration management, credit quality, and expense efficiency. Vanguard Total Treasury ETFs provide broad exposure across the yield curve with institutional pricing. iShares 7-10 Year Treasury ETFs capture the intermediate segment where risk-reward appears most attractive given current yield curve dynamics.
 
Buy signals currently favor short-to-intermediate Treasuries (1-10 year maturities) for income generation plus potential price appreciation if the Fed cuts rates. These positions offer 4.0-4.5% yields with limited duration risk.
Investment-grade corporate bond ETFs provide 80-150 basis point yield enhancement over Treasuries with manageable credit exposure.
Sell or avoid recommendations apply to ultra-long Treasury bond rates today (20+ year maturities) if yield curve steepening accelerates. These instruments face the greatest price depreciation if long-term rates rise further. However, they may suit liability-matching strategies for investors with specific long-dated obligations.
High-yield corporate bonds require careful evaluation in the current environment. While spreads remain tight, economic uncertainty could widen spreads rapidly, causing price declines that offset yield income. High-yield positions should represent no more than 10-15% of fixed-income allocations and focus on issuers with strong cash flow coverage.
Municipal bonds offer tax-equivalent yields attractive to high-income investors in higher tax brackets. Current 10-year municipal yields of 3.5-4.0% translate to 5.5-6.3% tax-equivalent returns for 37% federal bracket investors. State-specific issues provide additional tax benefits for residents of high-tax jurisdictions.
Savings bonds maintain competitiveness for conservative cash allocations. Series I bonds at 4.03% provide inflation protection unavailable in nominal Treasuries, with tax deferral and education tax exclusion benefits. Series EE bonds guarantee doubling in 20 years, equivalent to 3.53% annualized returns, suitable for long-term college savings or retirement planning.

How to Invest in Bonds Guide – From Beginner to Advanced (2026 Edition)

TreasuryDirect.gov enables zero-commission Treasury purchases directly from the government. Account setup requires Social Security number, bank account linkage, and email verification. Available instruments include Treasury bills (4-week to 52-week), notes (2-year to 10-year), bonds (20-year to 30-year), Treasury Inflation-Protected Securities (TIPS), and Floating Rate Notes (FRNs).
 
The bond ladder strategy involves purchasing individual bonds with staggered maturity dates to provide predictable income and principal return.
Savings bonds comparison I bonds versus EE bonds versus Treasury yields
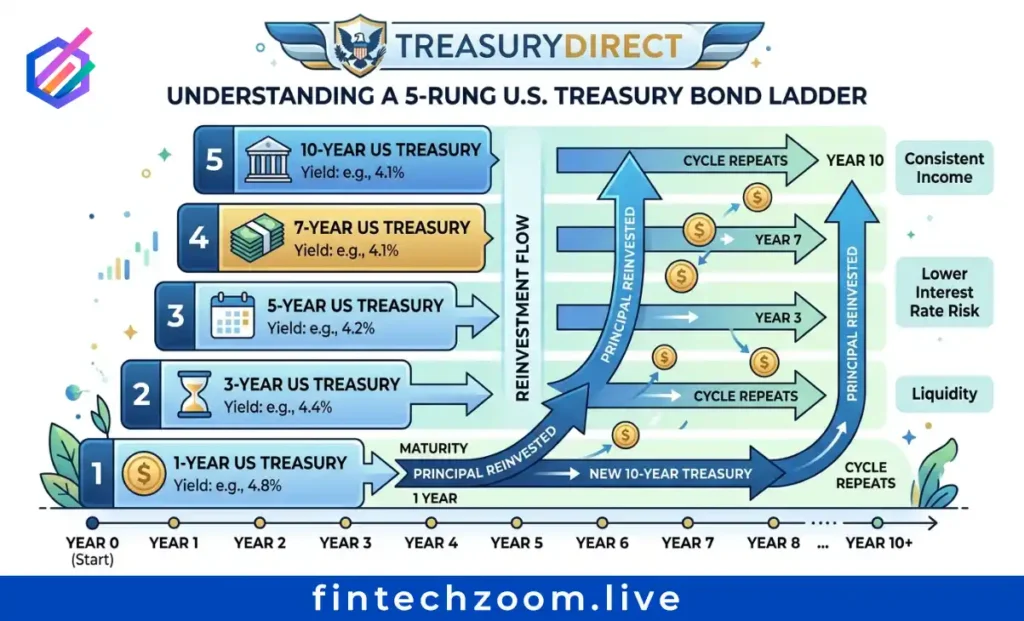
A 2026 ladder might include 1-year, 2-year, 3-year, 5-year, and 10-year Treasuries, with maturing principal reinvested at the long end. This approach mitigates interest rate risk while maintaining liquidity options.
Bond yield versus bond price relationship follows mathematical inverse correlation. When yields rise, prices fall, with longer durations experiencing greater price sensitivity. A 10-year Treasury with 8-year duration declines approximately 8% in price for every 1% yield increase. Understanding this relationship prevents panic selling during rate-driven price declines.
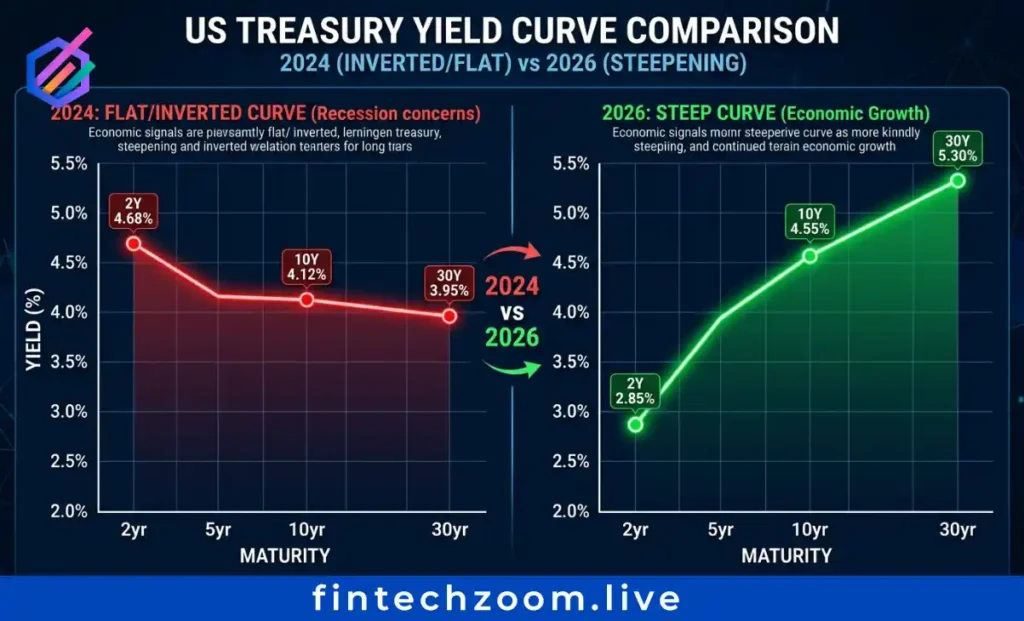
The inverted yield curve phenomenon that characterized 2023-2024 has largely normalized, with 10-year yields now exceeding 2-year yields by 50 basis points. This steepening historically precedes economic expansion but may also reflect term premium increases from debt supply concerns. Current curve shape favors intermediate maturities over extreme short or long positions.
Government versus corporate bonds present distinct risk-return profiles. Treasuries carry no credit risk but face inflation and rate risk. Corporate bonds add credit risk compensated by yield spreads. In 2026, investment-grade corporate spreads near historic lows suggest limited compensation for credit risk, favoring Treasury allocations for risk-averse investors.
Best bond ETF selections include:
  • Vanguard Total Treasury ETF: 0.05% expense ratio, broad duration exposure
  • iShares 7-10 Year Treasury ETF: Intermediate focus, 4.2% yield-to-maturity
  • Vanguard High-Yield Corporate ETF: 4.5% yield, diversified credit exposure
  • iShares National Muni Bond ETF: 3.8% yield, tax-advantaged income
  • Schwab US TIPS ETF: Inflation protection, real yield exposure

Treasury Bond Rates Today vs Stocks Comparison 2026 – Where to Allocate in a Higher-for-Longer World

Historical performance data demonstrates bonds’ role as portfolio ballast during equity volatility periods. In 2022, when stocks declined 18%, intermediate Treasuries fell only 12%, while short-term Treasuries declined less than 5%. This downside protection justifies fixed-income allocations even when equity returns appear more attractive.
The 2026 investment outlook suggests bonds for income generation and diversification, growth stocks for capital appreciation. With 10-year Treasuries yielding 4.3% and S&P 500 earnings yields near 5.0%, the risk premium for equities has narrowed, making high-quality bonds relatively attractive for risk-adjusted returns.
Portfolio allocation models require personalization based on age, risk tolerance, and income needs. Traditional 60/40 stock/bond allocations face pressure from correlated declines during rate shock periods. Alternative approaches include all-weather portfolios balancing growth, inflation, and deflation scenarios, or barbell strategies combining short-term bonds with long-term growth equities.
Meme stocks like GameStop and AMC demonstrate extreme volatility that bonds offset through stability. When equity sentiment deteriorates, Treasury prices typically rise as investors seek safety, providing negative correlation benefits. Rotation from speculative equities to high-quality bonds during market stress preserves capital for future opportunities.
EV disruptors including Lucid and Rivian show particular sensitivity to interest rate changes. These capital-intensive companies rely on debt financing for operations and expansion. Rising Treasury yields increase their borrowing costs while reducing the present value of future profit projections. This double impact creates elevated risk for speculative growth companies in higher-rate environments.

Bond Ladder Strategy Guide + Duration Risk Explained

Building a 2026 bond ladder requires selecting maturities that align with cash flow needs and reinvestment expectations. A five-rung ladder might include 1-year, 2-year, 3-year, 5-year, and 10-year Treasuries with equal dollar allocations. As the 1-year bond matures, proceeds purchase a new 10-year bond, maintaining the ladder structure while capturing current yields.
Duration risk measures price sensitivity to interest rate changes. Modified duration of 5 years indicates approximately 5% price decline for every 1% yield increase. Short-term bonds (1-3 year duration) minimize this risk but offer lower yields. Long-term bonds (15+ year duration) maximize yield but expose portfolios to significant volatility.
Current yield curve positioning suggests intermediate durations (5-8 years) optimize the risk-reward tradeoff. These maturities capture most of the available yield while limiting duration exposure if rates rise further. The steep curve provides incremental yield for extending maturity from 2 years to 10 years, justifying modest duration extension.
Real-world ladder implementation through TreasuryDirect requires minimum $100 purchases per security, with no maximum limits for most instruments. Electronic holdings simplify management and eliminate paper certificate risks. Automatic reinvestment options facilitate ladder maintenance without active trading decisions.

How to Buy Treasury Bonds Rates Today Direct – Zero-Commission Playbook

TreasuryDirect account establishment takes approximately 10 minutes online. Required information includes Social Security number, U.S. address, bank account details for funding purchases, and email address for notifications. Account verification typically completes within 24 hours, enabling immediate trading capabilities.
Treasury bill purchases suit investors seeking short-term cash management with maturities from 4 weeks to 52 weeks. These instruments sell at discount to face value, with returns representing the difference between purchase price and maturity value. Current 1-year Treasury bills yield approximately 4.1-4.3%.
Treasury notes (2-year to 10-year) provide intermediate duration exposure with semi-annual interest payments. These instruments trade in $100 increments with active secondary markets ensuring liquidity. Notes suit income investors seeking predictable cash flows without long-term commitment.
Treasury bonds (20-year to 30-year) offer maximum yield for liability-matching strategies. These long-duration instruments require careful evaluation of inflation and rate risks but provide guaranteed income for retirement planning or endowment management. Current 30-year yields near 4.9% represent multi-decade highs.
Treasury Inflation-Protected Securities (TIPS) provide real yield exposure with principal values adjusting for CPI changes. Current 10-year TIPS yields near 1.5-2.0% offer positive real returns absent in much of the 2010-2021 period. TIPS suit investors concerned about inflation erosion of nominal returns.
Tax implications favor Treasury securities over corporate bonds for high-bracket investors. Treasury interest remains exempt from state and local income taxes, providing 0.5-1.0% yield enhancement on a tax-equivalent basis for residents of high-tax states. This advantage compounds over multi-year holding periods.
Liquidity considerations favor Treasury ETFs for investors requiring rapid position adjustments. While TreasuryDirect purchases can be sold through the Secondary Market program, execution takes several business days. ETF shares trade intraday with immediate settlement, providing flexibility for dynamic asset allocation.

Actionable Takeaways

Treasury bond rates today present opportunities unseen in over a decade, with risk-free yields exceeding 4% across much of the curve. The 2026 outlook suggests continued elevation with potential for modest declines if the Federal Reserve achieves soft landing objectives. Investors should emphasize intermediate durations, maintain credit quality discipline, and utilize tax-advantaged savings bonds for appropriate allocations.
FintechZoom.Live delivers the real-time monitoring and analysis necessary for successful fixed-income investing in volatile markets. Track live Treasury yields alongside Magnificent 7 stock correlations, receive alerts for significant rate movements, and access expert commentary on Federal Reserve policy developments.
Subscribe now for daily bond market alerts, yield curve analysis, and integrated stock market intelligence. Your edge starts here – live.
 
Key Takeaways:
  • Elevated rates persist through 2026 – CBO projects 10-year Treasury rates at 4.1% for 2026, rising to 4.3% by 2027, with interest costs consuming over $1 trillion annually.
  • Yield curve steepening creates opportunity – Long-term rates are rising faster than short-term rates, favoring intermediate-duration bond strategies over ultra-long positions.
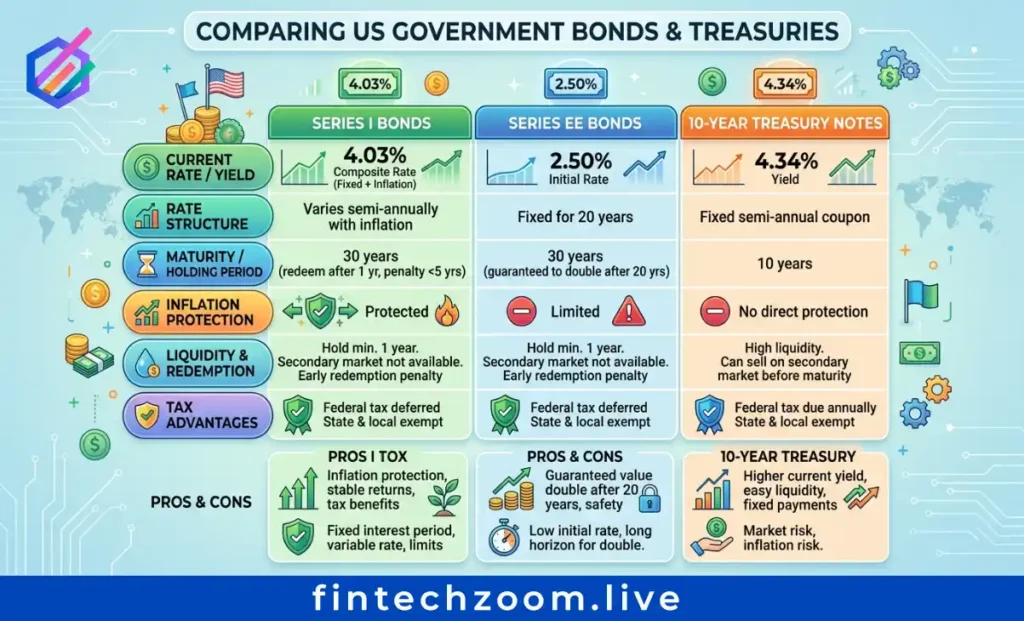
  • Savings bonds offer inflation protection – Series I bonds currently yield 4.03% with inflation adjustment, while Series EE bonds guarantee doubling in 20 years at 2.50% fixed.
  • Federal Reserve policy remains data-dependent – Eight FOMC meetings in 2026 will determine the path from current 3.50-3.75% federal funds rate toward projected 3.00-3.25% by year-end.
  • Record debt issuance requires vigilance – OECD sovereign borrowing hits $18 trillion in 2026, increasing supply pressure and demanding selective credit quality focus.

Analyze, Adapt, and Thrive in the Digital Finance Era

Navigate the intersection of capital and code with expert analysis on emerging market trends and disruptive technologies. Our content delivers actionable intelligence on everything from decentralized finance to AI-driven investing, empowering you to leverage innovation for sustainable growth. Dive into the data-driven insights that are actively redefining the global financial landscape.

Curated Editorial Insights Across FintechZoom’s Core Verticals: Thought-provoking analysis in Markets, Business Strategy, Crypto Innovation, Personal Finance, Economic Policy, and Lifestyle Wealth, designed to challenge conventional thinking, deepen financial literacy, and empower readers to make smarter, forward-looking decisions.