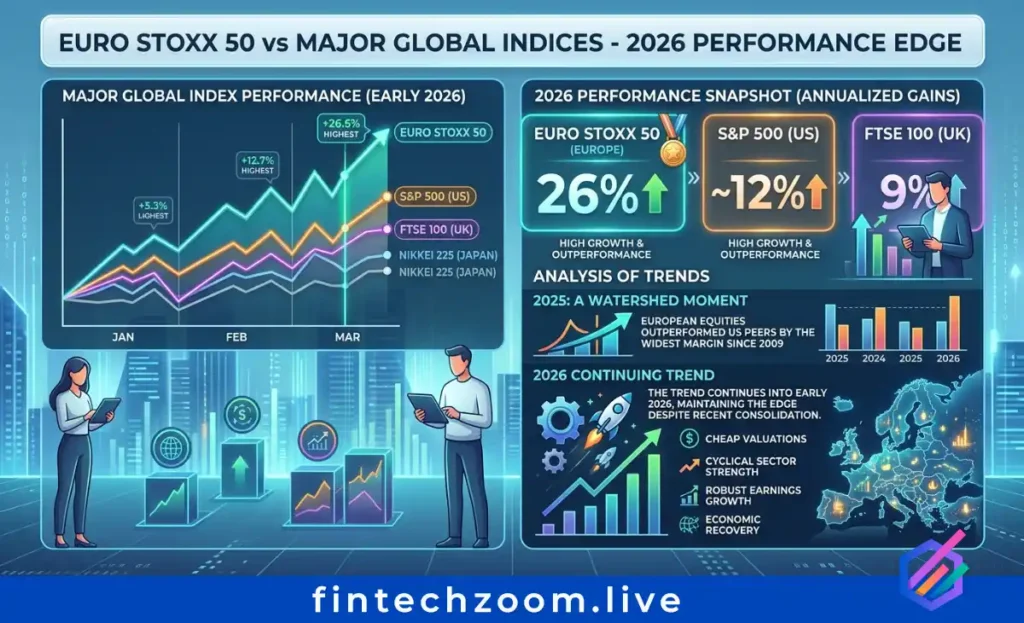
Valuation differentials favor European allocations on pure metrics. The S&P 500’s forward P/E of 22x versus Euro STOXX 50’s 15x represents a 47% premium for US equities, the widest disparity since 2010. This gap reflects divergent sector compositions: US indices concentrate in high-growth technology (NVIDIA, Microsoft, Apple) while European benchmarks emphasize mature industrials, financials, and energy. Should AI capital expenditure cycles mature or face regulatory constraints, the valuation compression potential favors European value proxies.
Currency effects significantly impact cross-border return calculations. EUR/USD appreciation during 2025 enhanced dollar-based returns for Euro STOXX 50 investors by approximately 8% above local currency performance. Conversely, euro strength compresses export competitiveness for index components including Airbus, SAP, and Siemens. Forward currency hedging through futures or ETF share classes can neutralize this volatility for investors seeking pure equity exposure without FX risk.
Volatility characteristics distinguish European blue-chips from global alternatives. Euro STOXX 50 historical volatility averages 18% annualized versus 20% for the S&P 500 and 22% for the Nasdaq 100, offering modest downside protection during risk-off episodes. However, correlation spikes during systemic stress events (March 2020, February 2022) limit diversification benefits precisely when needed most.
The FTSE 100 comparison highlights eurozone versus UK divergence. While both indices trade at discount valuations to US peers, Euro STOXX 50 offers superior sector diversification excluding dominant energy and mining concentrations present in the UK benchmark. Additionally, eurozone monetary policy coordination through the ECB provides more predictable liquidity conditions than Bank of England independence.
Buy or Sell Signals for Euro STOXX 50 in 2026 – Actionable Investor Guide
Should investors buy or sell Euro STOXX 50 at current levels? Current technical and fundamental indicators suggest a hold-to-accumulate stance on weakness rather than aggressive new position establishment at 5,900+ levels. Momentum oscillators show neutral readings following February overextension, while macroeconomic uncertainty from Middle East conflicts warrants position sizing discipline.
Analyst consensus aggregates to a moderate buy rating, with 55% of covering firms issuing overweight recommendations versus 30% neutral and 15% underweight. Price target distributions center at 6,100, implying modest upside from current quotations. Risk/reward ratios improve significantly on pullbacks toward 5,750–5,800 support zones, where stop-loss placement below 5,700 offers defined risk parameters.
Sector rotation signals favor selective exposure over broad index ownership. Healthcare components (Novo Nordisk, Roche, AstraZeneca) demonstrate defensive characteristics during energy price volatility, while financials (Santander, Allianz, BNP Paribas) benefit from ECB rate stability at 2.0% deposit levels. Technology exposure through ASML requires monitoring of China export license developments, where restriction intensification could trigger 15–20% single-stock corrections.
Momentum indicators for Euro STOXX 50 today show mixed signals. The Moving Average Convergence Divergence (MACD) line recently crossed below the signal line, generating technical caution flags. However, accumulation/distribution line trends remain positive, suggesting institutional money maintains positions despite price consolidation. Volume profile analysis identifies 5,850–5,900 as high-volume nodes providing structural support.
Risk management protocols should account for ECB policy pivot potential. Current market pricing anticipates rate stability through mid-2026, but inflation acceleration above 3% (as projected by ABN AMRO for May 2026) could force hawkish reversals. Such scenarios historically compress equity multiples by 2–3 points, implying 10–15% index downside regardless of earnings trajectory.
Eurozone Market News Today – What Is Moving the Index Right Now
What immediate factors are impacting Euro STOXX 50 performance? April 2026 earnings season carries unusual significance as companies report Q1 results against dramatically shifted macroeconomic backdrops. LSEG I/B/E/S data indicates STOXX 600 earnings growth of 4% year-over-year, though this aggregate conceals stark sectoral bifurcation: energy companies project 24.9% earnings expansion while all other sectors collectively manage just 1.5% growth.
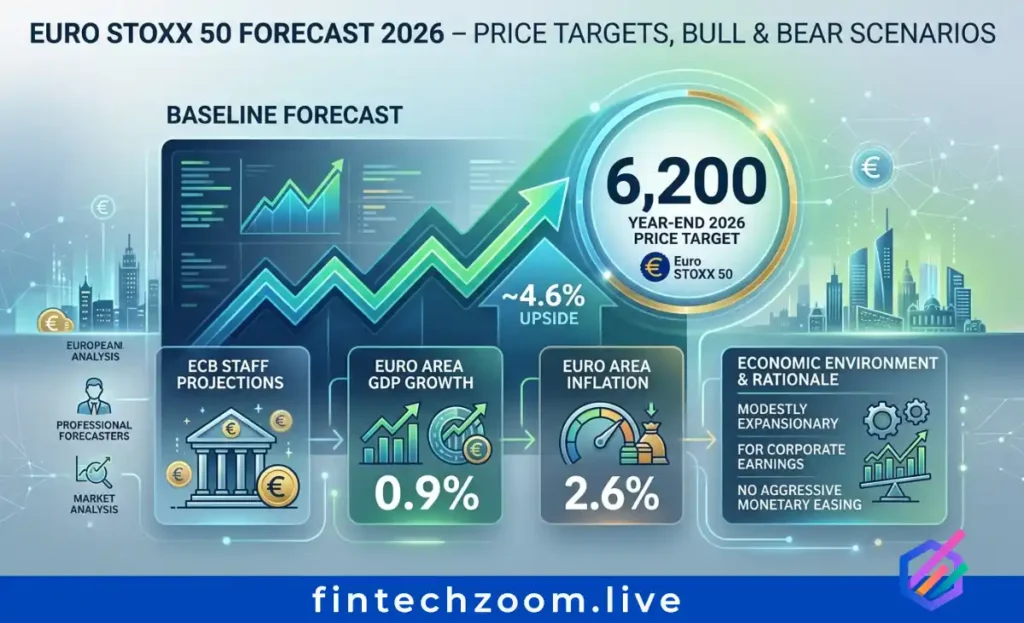
The European Central Bank’s March 2026 meeting maintained interest rates at current levels while introducing adverse scenario projections reflecting Middle East conflict escalation. ECB staff now model GDP growth at 0.9% for 2026 (down from 1.3% pre-conflict estimates) with inflation elevated to 2.6%. These revisions reflect energy price assumptions showing quarterly oil averaging $90 per barrel in Q2 2026 before gradual decline.
Geopolitical risk premiums have widened credit spreads and elevated volatility indices. The VIX-equivalent for European equities (VSTOXX) trades at elevated levels relative to 2025 averages, reflecting uncertainty regarding Iran conflict duration and potential Strait of Hormuz shipping disruptions. Goldman Sachs European economics estimates the war has already reduced euro area GDP growth by 0.7 percentage points while adding 1.4 percentage points to year-end inflation forecasts.
Corporate earnings guidance during April will determine whether February highs near 6,200 represent temporary resistance or sustainable breakout levels. Management commentary regarding energy cost pass-through capabilities, China demand sustainability, and AI infrastructure investment timelines will drive component-specific volatility. ASML’s order book trends and Novo Nordisk’s Wegovy pricing power remain particularly consequential given their outsized index influence.
The FintechZoom euro stoxx tracker aggregates these data streams into actionable intelligence, alerting subscribers to ECB policy statement releases, earnings calendar events, and technical level breaches. Real-time monitoring of SX5E futures today provides early indication of institutional positioning shifts before cash market opens.
Conclusion
Euro STOXX 50 today represents a compelling allocation opportunity within diversified portfolios, offering exposure to established European multinationals at valuation discounts to US peers. Current price levels near 5,926 EUR provide reasonable entry points for long-term investors, though tactical patience may reward those awaiting pullbacks toward 5,800 support. The convergence of German fiscal stimulus, ECB policy normalization, and potential geopolitical de-escalation creates asymmetric upside potential toward 6,400 targets while defined support levels limit downside risk.
Your edge starts here, live. Bookmark this page for daily euro stoxx 50 today updates, 2026 forecasts, and buy/sell signals that move markets before they happen. Subscribe to FintechZoom.Live for instant alerts on SX5E moves, ETF recommendations, and expert European blue-chip analysis.
Key Takeaways:
Euro STOXX 50 today trades near 5,926 EUR, up 26% year-over-year but consolidating below February 2026 highs as energy price volatility and Middle East conflict uncertainty create near-term headwinds.
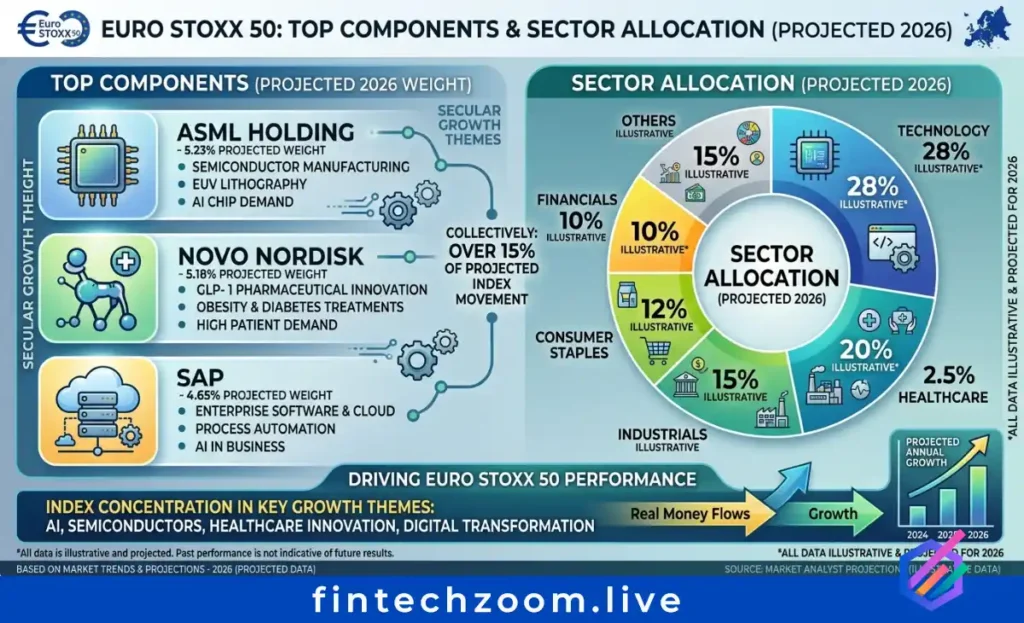
ASML, Novo Nordisk, and SAP dominate current component weightings at 5.23%, 5.18%, and 4.65% respectively, representing technology and healthcare sector concentration.
ECB March 2026 projections cut euro area GDP growth to 0.9% for 2026 (down from previous 1.3% estimates) while raising inflation forecasts to 2.6% due to energy price shocks.
Analyst consensus positions the index reaching 6,200 by year-end 2026 under baseline scenarios, with bullish targets at 6,400 contingent upon German fiscal stimulus effectiveness and Ukraine conflict resolution.
Forward P/E ratios of 15x for European equities versus 22x for the S&P 500 suggest relative valuation advantages for eurozone blue-chips entering Q2 2026.
The ECB held deposit facility rates at 2.0% in March 2026, maintaining restrictive monetary policy despite energy-driven inflation acceleration to 2.5% in March.