
How to invest in stock market is the most searched financial question of the decade، and in 2026, the bar for quality answers has never been higher. Markets have climbed to fresh all-time highs, AI-powered tools have collapsed the research gap between retail and institutional investors, and the S&P 500 hit 7,209 on April 30, 2026. Yet nearly 57% of Americans still report feeling afraid to invest, leaving trillions sitting idle in low-yield savings accounts.
This guide closes that gap. Every section below is built from real market behavior, current data, and the practical mechanics of investing in 2026، not recycled theory from a decade ago.
Disclaimer: This content is for educational purposes only and does not constitute personal financial advice. Always consult a qualified financial adviser before making investment decisions. For official resources, visit the SEC Investor Education portal.
When you buy a share of stock, you become a fractional owner of a real business. You own a claim on its assets, earnings, and future growth، not just a number moving on a screen. This ownership mindset separates investors who build long-term wealth from those who chase short-term price movements and lose.
Before buying any stock, experienced investors ask three questions: Is this a genuinely good business? Is management competent and aligned with shareholders? Is the current price reasonable given the company’s earnings power and competitive position? These questions apply whether you are buying Apple on Nasdaq or a small-cap stock on the Russell 2000.
Stocks have historically delivered returns that outpace inflation over long holding periods. The S&P 500 has averaged approximately 13% per year over the last decade, making consistent equity exposure one of the most effective wealth-building tools available to retail investors، provided you understand both the potential and the risks.
Before placing your first trade, know the environment you are entering.
As of mid-2026, the S&P 500 is up approximately 9.8% year-to-date, while the Russell 2000 small-cap index has surged nearly 18%, driven by domestic revenue exposure amid ongoing geopolitical uncertainty. The 10-year U.S. Treasury yield sits at 4.40%, and the fed funds target range is 3.50–3.75%.
The macro picture has three defining features right now:
None of this means you should wait. Markets do not move in straight lines, and the investors who consistently enter and stay invested over long time horizons capture returns that market-timers miss. What it does mean is that diversification and position sizing matter more today than they did in lower-valuation environments.
You do not need thousands of dollars. You need an account, a plan, and the discipline to start.
Commission-free trading is now universal across all major brokerage platforms. Fractional shares let you buy $10 or $50 worth of a stock even if a full share costs hundreds of dollars. You can own a piece of Apple (AAPL), Microsoft (MSFT), or Nvidia (NVDA)، or a broad index fund that holds all three، from your first deposit.
For most beginners in 2026, the strongest starting point remains a broad index fund. Options like the Vanguard S&P 500 ETF (VOO) or the iShares Core S&P 500 ETF (IVV) deliver instant exposure to 500 of the largest U.S. companies for a single, very low annual expense ratio. Alternatively, AI-focused ETFs like AIQ or IGPT provide targeted exposure to the sector driving the current growth cycle, at lower single-stock risk than buying Nvidia or Microsoft outright.
The recommended beginner sequence for 2026:
Starting small keeps early mistakes manageable while your experience accumulates.
Opening and funding your account correctly is the single most important administrative decision you will make.
Your account type determines your tax situation for decades. Getting this right before your first deposit is not optional.
| Account Type | Tax Treatment | 2026 Contribution Limit | Best For |
|---|---|---|---|
| Roth IRA | Contributions taxed now; gains grow tax-free | $7,000 (under 50) / $8,000 (50+) | Most beginners; long time horizons |
| Traditional IRA | Contributions may be deductible; taxed on withdrawal | $7,000 (under 50) / $8,000 (50+) | Higher earners expecting lower retirement income |
| 401(k) | Pre-tax contributions; taxed on withdrawal | $23,500 (under 50) | Employer-sponsored; always capture the full match first |
| Standard Brokerage | No contribution limits; gains taxable in year realized | Unlimited | After maxing tax-advantaged accounts |
The Roth IRA is the right starting account for most beginners. Your contributions can be withdrawn at any time without penalty, gains grow completely tax-free, and you pay no capital gains tax when you sell. For investors who expect their income، and therefore their tax rate، to rise over their careers, locking in today’s lower tax rate on future gains is a structural advantage.
If your employer offers a 401(k) with matching contributions, always contribute enough to capture the full match before opening an IRA. That match is an immediate 50% to 100% return on that portion of your money، no investment in the market can replicate that.
Most modern brokerages provide instant access to a portion of deposited funds for trading. Full ACH settlement typically takes one to three business days. Setting up automatic recurring deposits، weekly, bi-weekly, or monthly، builds the investing habit and removes the temptation to time the market.
Never skip the research phase. For broad index funds, the research is straightforward: verify the expense ratio, confirm the index it tracks, and check the top holdings. For individual stocks, use the fundamental analysis framework described below. Look at three to five years of earnings history, revenue trends, free cash flow generation, and the company’s competitive position in its industry before committing capital.
Understanding order types protects you from paying more than intended، especially in volatile markets.
| Order Type | What It Does | When to Use It |
|---|---|---|
| Market Order | Executes immediately at the best available price | Large-cap stocks with high daily volume only |
| Limit Order | Executes only at your specified price or better | Most situations; default for individual stocks |
| Stop-Loss Order | Sells automatically if the stock falls to a set price | After purchase, to define maximum acceptable loss |
| Stop-Limit Order | Triggers at a stop price; executes only at limit price | Volatile stocks where gap-down risk exists |
For most investors, the limit order is the safest default. You control the maximum price you pay, and the order simply will not execute if the market moves against you before it fills.
Also Read This:
Fintech Cybersecurity Trends 2026 explores the AI arms race reshaping digital defense, where Agentic SOCs counter autonomous attacks, Shadow AI introduces internal risk, and quantum-ready cryptography becomes non-negotiable for long-term data integrity. The post also highlights the convergence of fraud, AML, and cybersecurity into unified FRAML operations, plus emerging threats like MFA bypass and tokenized asset vulnerabilities that demand proactive, regulation-aligned resilience strategies.
Fundamental analysis is the process of reading a company’s finances to judge its real worth versus its current price.
Three financial documents form the foundation of every serious stock analysis.
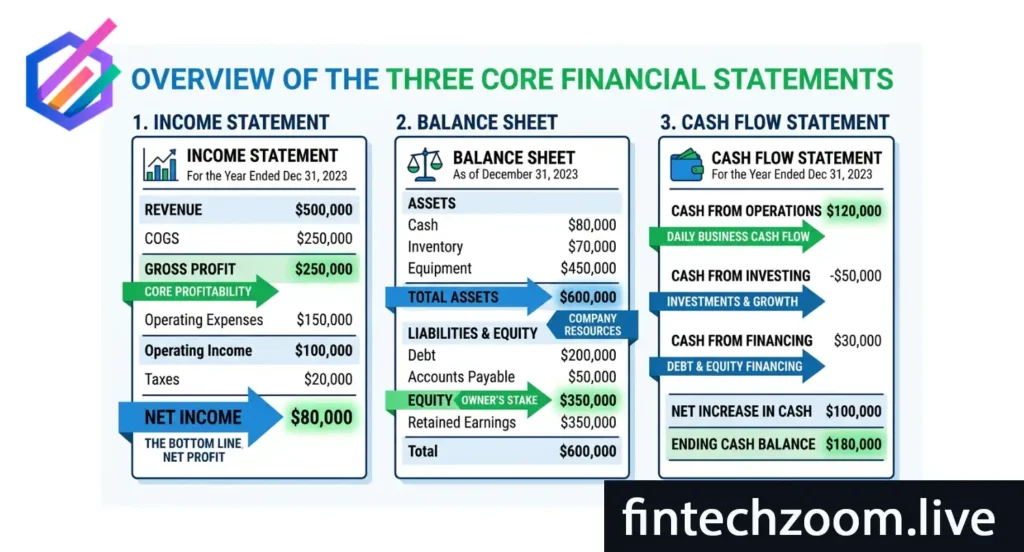
The income statement shows revenue, costs, and profit over a specific period، typically a quarter or a full year. Look for revenue that grows consistently year over year, and for profit margins that are stable or expanding. A company that grows revenue while margins shrink is spending faster than it earns، a warning that frequently precedes significant stock price weakness.
Key metrics to check: gross margin, operating margin, and net income growth rate. Compare these against industry peers, not just against the company’s own history.
The balance sheet shows what the company owns (assets) and what it owes (liabilities). A financially healthy company holds more assets than liabilities and keeps debt at levels its earnings can comfortably service. Excessive debt becomes dangerous when interest rates rise or earnings contract، both of which are live risks in the 2026 environment.
Watch the debt-to-equity ratio and compare it to sector averages. For technology companies, look specifically at cash and equivalents versus long-term debt. Cash-rich balance sheets provide resilience through market stress that debt-heavy competitors cannot match.
The cash flow statement is the most revealing of the three documents because it tracks actual cash moving in and out of the business، far harder to manipulate than accounting profit.
Free cash flow (FCF) is the key metric: operating cash flow minus capital expenditures. Companies that consistently generate strong FCF can fund their own growth, return capital to shareholders through dividends or buybacks, and absorb economic shocks without issuing dilutive equity. For 2026, FCF generation is especially important to assess given tightening financial conditions.
All public company financial filings are freely available at SEC EDGAR.
In 2026, AI research tools have genuinely changed what individual investors can accomplish. Tools like ChatGPT, Gemini, and Claude can read 100-page annual reports, compare two companies side-by-side, extract key metrics from earnings call transcripts, and summarize hours of financial commentary in seconds.
This is not a replacement for understanding what you own. AI does not replace the fundamentals، it accelerates your ability to apply them. Before using any AI tool for stock research, build your foundational understanding of income statements, balance sheets, and cash flow. Then use AI to work faster and cover more ground than any individual analyst could a decade ago.
Technical analysis does not predict the future. It maps the recent behavior of buyers and sellers to help you choose better entry and exit points.
Start with the candlestick format. Each candle represents one unit of time، a day, week, or month depending on your settings. A green candle means the closing price was higher than the opening price, indicating net buying pressure during that period. A red candle indicates net selling pressure.
Reading clusters of candles reveals trends, reversals, and periods of indecision between buyers and sellers. The shape and relative size of individual candles adds further context، a long lower wick on a red candle, for example, suggests buyers stepped in before the session closed.
Moving averages smooth short-term price noise to reveal the underlying trend direction. The 50-day and 200-day moving averages are the most widely watched levels in professional trading.
A stock trading above both averages is in a structurally positive trend. When the 50-day moving average crosses below the 200-day، the “death cross”، selling pressure typically increases. The opposite crossing, called the “golden cross,” often precedes a period of relative strength. Neither signal is infallible, but both provide useful context.
The RSI measures whether a stock has been bought or sold beyond what market conditions justify on a scale of 0 to 100. Readings above 70 suggest the stock may be overbought and due for a pullback. Readings below 30 suggest it may be oversold and approaching a potential recovery.
The RSI works best as a confirmation tool alongside fundamental analysis، not as a standalone buy or sell signal. A fundamentally strong company with an RSI below 30 during a broader market selloff is often a high-quality entry point.
There is no single right strategy. The right approach depends on your goals, time horizon, and willingness to do ongoing research.
| Strategy | Core Question | Best Time Horizon | Key Metric | Primary Risk |
|---|---|---|---|---|
| Value Investing | Is this stock cheap relative to its earnings and assets? | 3 to 7 years | P/E ratio, Price/Book | Value trap: stock is cheap because the business is deteriorating |
| Growth Investing | Will this company grow earnings far faster than the market? | 2 to 5 years | Revenue growth rate, Total Addressable Market | Valuation collapse if growth disappoints |
| Dividend Investing | Does this company pay and reliably grow its dividend? | 5 to 20 years | Dividend yield, Payout ratio | Dividend cuts during earnings downturns |
| Index Investing | Do I want broad market returns with minimal research? | 10 to 30 years | Expense ratio, Tracking error | Full market downside with no individual stock protection |
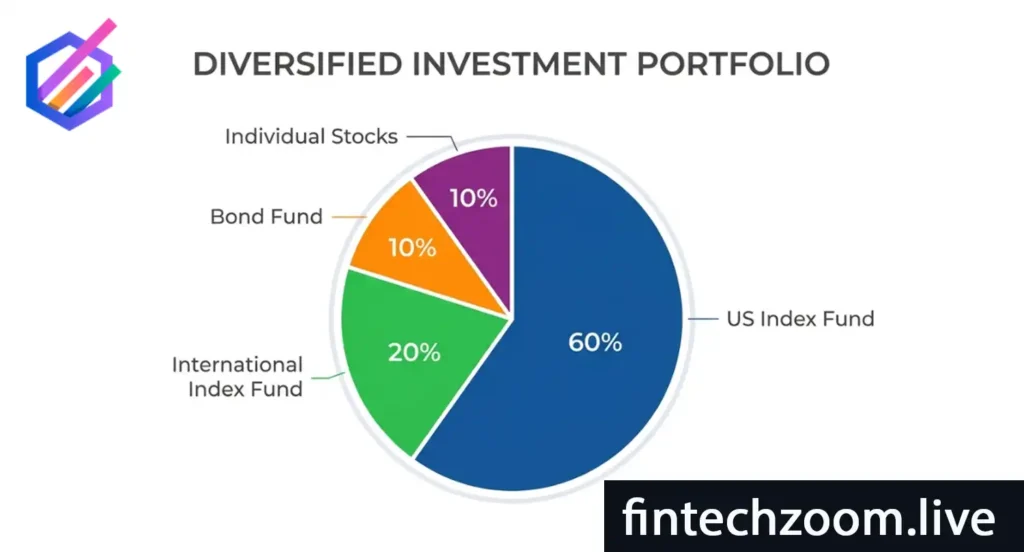
Most successful long-term investors combine these approaches. A core position in broad index funds provides reliable market exposure. A smaller allocation to carefully selected individual stocks، or sector ETFs in areas like AI infrastructure، allows you to act on specific insights without concentrating risk.
For 2026 specifically, the concentration risk inside major indices deserves attention. The 10 largest companies in the S&P 500 now constitute over 40% of total index market capitalization. An investor who holds only a standard S&P 500 index fund has more exposure to a handful of mega-cap technology companies than many people realize. Layering in small-cap exposure through a Russell 2000 ETF or international exposure through a developed-market fund provides genuine diversification beyond what the S&P 500 alone delivers.
Owning different stocks is not the same as being diversified. Real diversification requires deliberate spread across multiple dimensions.
A genuinely resilient portfolio for 2026 spreads capital across:
Nearly $9.1 trillion currently sits in U.S. money market funds, capital that has not been allocated toward long-term wealth building. For investors who have accumulated cash waiting for the “right time” to invest, the historical record is clear: time in the market outperforms timing the market over virtually every meaningful investment horizon.
Every publicly traded company releases a quarterly earnings report. These documents contain far more actionable information than any news headline.
The MD&A section is where management explains in plain language what happened during the quarter and why. Pay attention to how leadership discusses challenges. Vague language around a specific business problem, or conspicuous omissions about a known risk, frequently signals that the issue is larger than the prepared remarks suggest.
Forward guidance is management’s estimate of next quarter’s expected revenue and earnings per share. If a company beats current-quarter numbers but guides below analyst consensus for the next quarter, the stock will almost always decline. The market prices future expectations, not past results.
Full transcripts from quarterly earnings calls are freely available through company investor relations pages and financial databases. The analyst Q&A section is the most valuable part, questions from sell-side analysts probe the weakest points in the business model. Direct, detailed management answers are a positive signal. Deflection, repeated talking points, or vague responses to pointed questions about margin pressure, customer churn, or competitive threats often indicate a developing problem.
Also Read This:
Instagram marketing tools 2026 have evolved far beyond simple schedulers, the platform’s AI-powered algorithm now rewards views, DM shares, and saves over likes, making the right tool stack a growth necessity. This guide breaks down every category from scheduling and analytics to DM automation and fintech-specific compliance stacks, with pricing benchmarks and build-your-own stack recommendations for every business size.
Position sizing and loss management are not optional skills. They determine whether setbacks are learning experiences or account-ending events.
Never let a single stock represent more than 5% to 10% of your total portfolio. This is not a conservative rule, it is the discipline that allows you to stay invested through the inevitable periods when individual holdings move against you.
A position capped at 5% that falls 50% damages your portfolio by 2.5%. An undisciplined 25% position with the same outcome damages it by 12.5%, a much harder hole to climb out of.
Stop-loss orders are effective tools for volatile positions, but their placement matters. Stops set too close to the current price trigger on normal daily volatility and remove you from positions that subsequently recover. A practical approach: set initial stop-losses 15% to 20% below your purchase price for individual stocks, and adjust them upward as the stock appreciates to protect gains.
Dollar-cost averaging means buying a fixed dollar amount of an investment at regular intervals, $100 per week, $500 per month, regardless of price. This approach eliminates the stress of trying to pick the optimal entry point. When prices fall, your fixed amount buys more shares. When prices rise, it buys fewer. Over time, this mechanical consistency produces an average cost below the average price paid, a structural advantage that markets consistently reward.
Understanding common errors is as important as understanding what to do. Here are the eight mistakes that cost beginning investors the most:
Q1: How much money do I need to start investing in the stock market in 2026? You can start with as little as $1 using fractional shares at commission-free brokerages. A more practical starting point is $100 to $500, which gives you enough to establish a position in a broad index fund and begin experiencing real market participation.
Q2: What is the safest way to invest in the stock market for beginners? A broad-market index fund, such as one tracking the S&P 500, combined with consistent monthly contributions is the safest approach for beginners. It eliminates single-stock risk, minimizes fees, and provides exposure to the overall economy rather than a specific company’s fate.
Q3: Is a Roth IRA better than a standard brokerage account for beginners? For most beginners, yes. A Roth IRA’s tax-free growth on investment gains is a structural advantage that compounds over decades. The annual contribution limits mean you will likely need a standard brokerage account as well once your portfolio grows, but starting with the Roth maximizes tax efficiency from day one.
Q4: How long should I hold a stock? The right holding period depends on your investment thesis. For broad index funds, the optimal holding period is as long as possible, ideally until you need the money in retirement. For individual stocks, hold as long as the original investment thesis remains intact. When the business changes in ways that invalidate your reason for owning it, that is the appropriate time to sell.
Q5: How do interest rates affect stock prices? Rising interest rates increase borrowing costs for companies, reduce consumer spending, and make bonds more attractive relative to stocks. This typically puts pressure on stock valuations, particularly growth stocks, where future earnings are discounted at a higher rate. In the current 2026 environment, with rate-hike risk rising as inflation runs above target, this relationship is directly relevant to portfolio positioning.
Q6: What are the best stocks to buy for beginners in 2026? Broad index funds are the best starting point for beginners regardless of market conditions. For those interested in individual stocks, focus on established companies with consistent free cash flow, low debt relative to earnings, and competitive advantages that are visible and durable. Names with long operating histories in sectors you understand are far better starting points than speculative early-stage companies.
Q7: What is dollar-cost averaging and does it actually work? Dollar-cost averaging means investing a fixed dollar amount at regular intervals regardless of price. It works because it removes timing decisions from the equation, prevents emotional reactions to volatility, and produces an average cost that is mechanically lower than the average price over time. It is most effective when applied consistently over multi-year periods.
Q8: How do I know when to sell a stock? Sell when your original investment thesis is broken, not because the price has fallen. If the company’s competitive position has deteriorated, management has proven untrustworthy, or the valuation has expanded to a level where future returns are implausible given realistic growth assumptions, those are substantive reasons to exit. Selling because a stock is down 15% when the underlying business remains strong is a common and costly error.
Q9: Is it safe to use AI tools for stock research in 2026? AI research tools are powerful aids for analysis, they can process earnings reports, compare financial ratios, and surface patterns across large datasets faster than any individual analyst. However, they are not licensed financial advisers and their outputs should be treated as research assistance, not definitive recommendations. Verify any AI-generated financial data against primary sources before acting on it.
Q10: What is the difference between a stock and an ETF? A stock is ownership in a single company. An exchange-traded fund (ETF) is a basket of securities, often dozens or hundreds of stocks, that trades on an exchange like a single stock. ETFs provide instant diversification, typically at very low cost. For most beginners, ETFs are a more appropriate starting point than individual stocks because a single purchase spreads risk across many companies simultaneously.

Curated Editorial Insights Across FintechZoom’s Core Verticals: Thought-provoking analysis in Markets, Business Strategy, Crypto Innovation, Personal Finance, Economic Policy, and Lifestyle Wealth, designed to challenge conventional thinking, deepen financial literacy, and empower readers to make smarter, forward-looking decisions.
FintechZoom.Live is your real-time gateway to smarter investing, delivering instant stock market updates, expert analysis, and actionable insights on the stocks that matter most. From Magnificent 7 giants like NVIDIA, Microsoft, and Tesla to high-momentum meme stocks like GameStop and AMC, we cover the full spectrum of opportunities with zero-delay reporting. Our platform specializes in low-competition, high-value SEO content clusters, prioritizing “buy or sell” decision guides, price predictions, and forecast analysis for retail and institutional investors alike. Whether you’re tracking EV disruptors Lucid and Rivian, AI leaders Palantir and C3.ai, or legacy dividend plays like Ford and IBM, FintechZoom.Live provides semantic-rich, data-driven coverage optimized for search visibility and investor clarity. With 50+ stock clusters, 500+ semantic keywords, and real-time market intelligence, we empower you to make informed decisions before the market moves. Your edge starts here live.
Disclaimer
The information provided on FintechZoom.Live is for informational purposes only and should not be considered financial or investment advice. Investing in cryptocurrencies, digital assets, or any financial product involves significant risk, including the potential loss of your entire investment. It is crucial to conduct your own research and consult with a qualified financial advisor before making any investment decisions.
FintechZoom.Live does not endorse any specific investment or financial product. We are not responsible for any losses or damages incurred as a result of using the information on our website.
Please be aware that the regulatory landscape for cryptocurrencies and digital assets is complex and varies across jurisdictions. It is important to understand the applicable regulations in your location before investing.
For further information on U.S. regulations, you may refer to the following resources:
Securities and Exchange Commission (SEC): https://www.sec.gov/
Commodity Futures Trading Commission (CFTC): https://www.cftc.gov/
Financial Crimes Enforcement Network (FinCEN): https://www.fincen.gov/
By using FintechZoom.Live, you acknowledge and agree to this disclaimer.

Your trusted source for stocks, crypto, commodities, and fintech news. Track live prices, explore market trends, and make informed financial decisions with data that moves as fast as the markets.